The data shows that the percentage of female cigarette smokers in a certain country declined from 21.8% in 1997 to 14.5% in 2015. Answer parts (A) through (B). O A. 30 4 154 10 20 Years since 1007 (1) (A) Applying linear regression to the data for females in the table produces the model f= -0.42t+21.78, where fis percentage of female smokers (written as a percentage) and t is time in years since 1997. Draw a scatter plot and a graph of the regression model on the same axes. Choose the correct answer below. Q OB. 30 15 0 10 20 Years since 1997 (1) Q Q OC. 15 10 20 Years since 1997 (1) Q G O D. 30 Percentage of Smoking Prevalence among U.S. Adults Males (%) Females (%) 27.8 25.5 15 Year 1997 2000 2003 2006 10 20 Years since 1997 (1) 2010 2015 23.9 23.7 21.4 16.8 21.8 20.6 19.5 17.7 16.2 14.5
The data shows that the percentage of female cigarette smokers in a certain country declined from 21.8% in 1997 to 14.5% in 2015. Answer parts (A) through (B). O A. 30 4 154 10 20 Years since 1007 (1) (A) Applying linear regression to the data for females in the table produces the model f= -0.42t+21.78, where fis percentage of female smokers (written as a percentage) and t is time in years since 1997. Draw a scatter plot and a graph of the regression model on the same axes. Choose the correct answer below. Q OB. 30 15 0 10 20 Years since 1997 (1) Q Q OC. 15 10 20 Years since 1997 (1) Q G O D. 30 Percentage of Smoking Prevalence among U.S. Adults Males (%) Females (%) 27.8 25.5 15 Year 1997 2000 2003 2006 10 20 Years since 1997 (1) 2010 2015 23.9 23.7 21.4 16.8 21.8 20.6 19.5 17.7 16.2 14.5

Functions and Change: A Modeling Approach to College Algebra (MindTap Course List)
6th Edition
ISBN:9781337111348
Author:Bruce Crauder, Benny Evans, Alan Noell
Publisher:Bruce Crauder, Benny Evans, Alan Noell
Chapter3: Straight Lines And Linear Functions
Section3.CR: Chapter Review Exercises
Problem 15CR: Life Expectancy The following table shows the average life expectancy, in years, of a child born in...

Related questions
Question
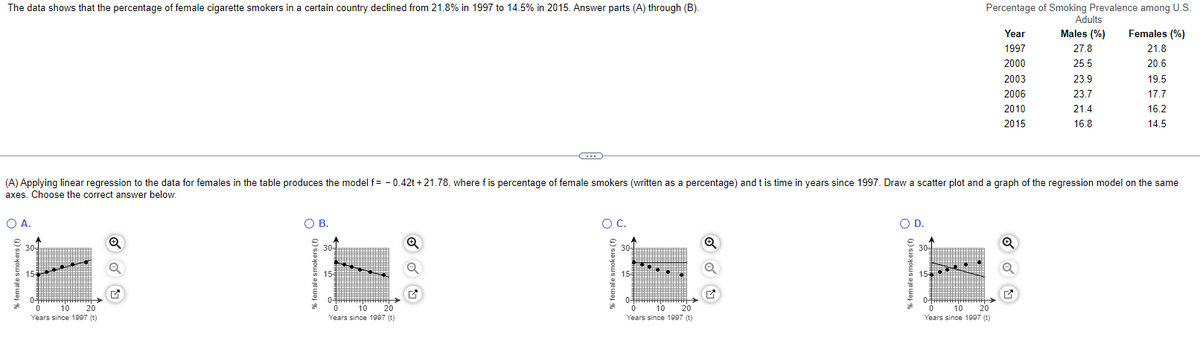
Transcribed Image Text:The data shows that the percentage of female cigarette smokers in a certain country declined from 21.8% in 1997 to 14.5% in 2015. Answer parts (A) through (B).
O A.
% female smol
30-
15
(A) Applying linear regression to the data for females in the table produces the model f= -0.42t +21.78, where f is percentage of female smokers (written as a percentage) and t is time in years since 1997. Draw a scatter plot and a graph of the regression model on the same
axes. Choose the correct answer below.
HEFUR HA
0 10 20
Years since 1997 (t)
Q
O B.
% female smokers
30-
153
03
10 20
0
Years since 1997 (t)
(…)
Q
Q
O C.
% female smokers (f)
30
15
0²
SOP
0
10 20
Years since 1997 (t)
O D.
% female smokers (f)
30+
15
Percentage of Smoking Prevalence among U.S.
Adults
Males (%) Females (%)
27.8
21.8
25.5
20.6
23.9
23.7
03
Year
1997
2000
2003
2006
2010
2015
0
10 20
Years since 1997 (t)
Q
21.4
16.8
G
19.5
17.7
16.2
14.5
Expert Solution
This question has been solved!
Explore an expertly crafted, step-by-step solution for a thorough understanding of key concepts.

This is a popular solution!

Trending now
This is a popular solution!

Step by step
Solved in 2 steps with 2 images

Recommended textbooks for you
Functions and Change: A Modeling Approach to Coll…
Algebra
ISBN:
9781337111348
Author:
Bruce Crauder, Benny Evans, Alan Noell
Publisher:
Cengage Learning


Functions and Change: A Modeling Approach to Coll…
Algebra
ISBN:
9781337111348
Author:
Bruce Crauder, Benny Evans, Alan Noell
Publisher:
Cengage Learning

Algebra and Trigonometry (MindTap Course List)
Algebra
ISBN:
9781305071742
Author:
James Stewart, Lothar Redlin, Saleem Watson
Publisher:
Cengage Learning

College Algebra
Algebra
ISBN:
9781305115545
Author:
James Stewart, Lothar Redlin, Saleem Watson
Publisher:
Cengage Learning