The data to the right show the average retirement ages for a random sample of workers in Country A and a random sample of workers in Country B. Complete parts a and b. Country A Counuy B 67.2 years 40 655 years Sample mean Sample size Population 40 standard deviation 4.3 years 5.4 years a. Perform a hypothesis test using a = 0.01 to determine if the average retirement age in Country B is higher than it is in Country A. Let population 1 be the workers in Country A and population 2 be the workers in Country B. Identify the null and alternative hypotheses. Choose the correct answer below. O A. Ho -2 #0 H, -2 =0 OC. Họ H -H2 <0 H H -2 20 O E. Ho -2 >0 O B. Ho: 1 -H s0 H, - >0 OD. Ho -H = 0 OF. Ho H-H2 20 H: H-2 <0 Calculate the appropriate test statistic. The test statistic is (Round to two decimal places as needed.) Determine the appropriate critical value(s). The critical value(s) is(are) (Round to two decimal places as needed. Use a comma to separate answers as needed.) Since the test statistic (1) - in the rejection region, (2) – Họ. There is (3). - evidence to conclude that the average retirement age in Country B is higher than it is in Country A. b. Determine the p-value and interpret the results. The p-value is (Round to three decimal places as needed.) Since the p-value is (4). a, (5) Ho. There is (6) evidence conclude that the average retirement age in Country B is higher than it is in Country A. (1) O does not fall O falls (2) O do not reject O reject (3) O insufficient O sufficient (4) O less than O greater than O equal to (6) O insufficient O sufficient (5) O do not reject O reject
The data to the right show the average retirement ages for a random sample of workers in Country A and a random sample of workers in Country B. Complete parts a and b. Country A Counuy B 67.2 years 40 655 years Sample mean Sample size Population 40 standard deviation 4.3 years 5.4 years a. Perform a hypothesis test using a = 0.01 to determine if the average retirement age in Country B is higher than it is in Country A. Let population 1 be the workers in Country A and population 2 be the workers in Country B. Identify the null and alternative hypotheses. Choose the correct answer below. O A. Ho -2 #0 H, -2 =0 OC. Họ H -H2 <0 H H -2 20 O E. Ho -2 >0 O B. Ho: 1 -H s0 H, - >0 OD. Ho -H = 0 OF. Ho H-H2 20 H: H-2 <0 Calculate the appropriate test statistic. The test statistic is (Round to two decimal places as needed.) Determine the appropriate critical value(s). The critical value(s) is(are) (Round to two decimal places as needed. Use a comma to separate answers as needed.) Since the test statistic (1) - in the rejection region, (2) – Họ. There is (3). - evidence to conclude that the average retirement age in Country B is higher than it is in Country A. b. Determine the p-value and interpret the results. The p-value is (Round to three decimal places as needed.) Since the p-value is (4). a, (5) Ho. There is (6) evidence conclude that the average retirement age in Country B is higher than it is in Country A. (1) O does not fall O falls (2) O do not reject O reject (3) O insufficient O sufficient (4) O less than O greater than O equal to (6) O insufficient O sufficient (5) O do not reject O reject

Linear Algebra: A Modern Introduction
4th Edition
ISBN:9781285463247
Author:David Poole
Publisher:David Poole
Chapter7: Distance And Approximation
Section7.3: Least Squares Approximation
Problem 31EQ

Related questions
Question
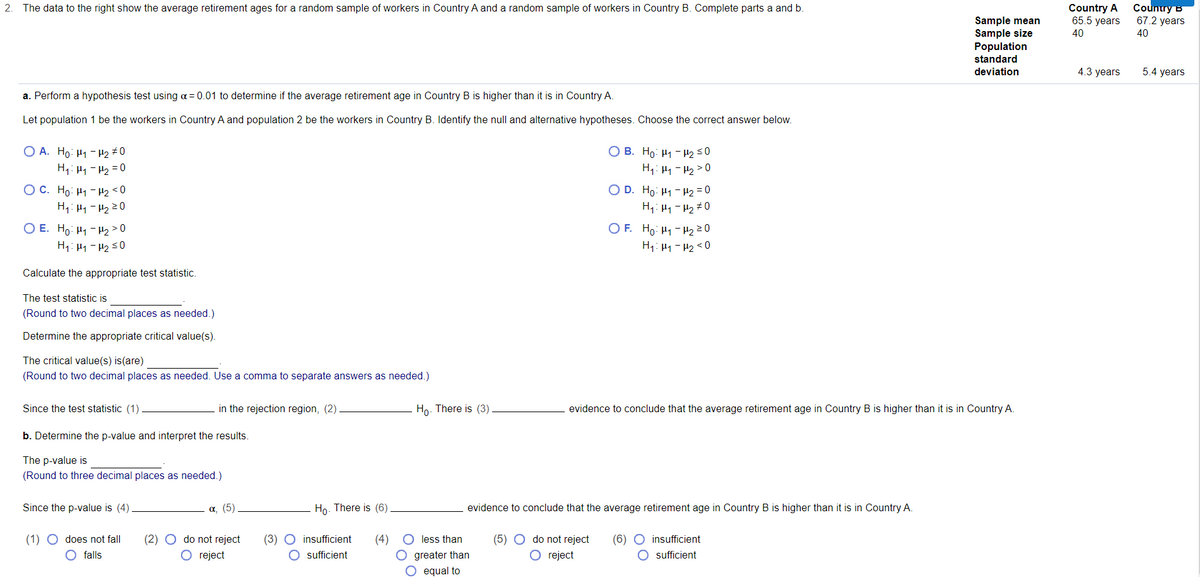
Transcribed Image Text:The data to the right show the average retirement ages for a random sample of workers in Country A and a random sample of workers in Country B. Complete parts a and b.
Country B
67.2 years
2.
Country A
65.5 years
Sample mean
Sample size
Population
40
40
standard
deviation
4.3 years
5.4 years
a. Perform a hypothesis test using a = 0.01 to determine if the average retirement age in Country B is higher than it is in Country A.
Let population 1 be the workers in Country A and population 2 be the workers in Country B. Identify the null and alternative hypotheses. Choose the correct answer below.
O B. Ho: H1 - H2<0
H1: Hy - H2> 0
O D. Ho: H1 -H2 = 0
H1: H1 - H2 #0
O F. Ho: H1 - H220
O A. Ho: H1 - 42 # 0
H1: H1- H2 = 0
O C. Ho: H1 - H2 < 0
H1: H1- H2=0
O E. Ho: H1 - H2 > 0
H1: 41 - H2 s0
H1: H1 - H2 <0
Calculate the appropriate test statistic.
The test statistic is
(Round to two decimal places as needed.)
Determine the appropriate critical value(s).
The critical value(s) is(are)
(Round to two decimal places as needed. Use a comma to separate answers as needed.)
Since the test statistic (1)
in the rejection region, (2)
Ho. There is (3)
evidence to conclude that the average retirement age in Country B is higher than it is in Country A.
b. Determine the p-value and interpret the results.
The p-value is
(Round to three decimal places as needed.)
Since the p-value is (4)
α, (5 )
Ho. There is (6)
evidence to conclude that the average retirement age in Country B is higher than it is in Country A.
(3) O insufficient
O sufficient
O less than
(6) O insufficient
O sufficient
(1) O does not fall
(2) O do not reject
(4)
(5) O do not reject
falls
O reject
greater than
O reject
O equal to
Expert Solution
This question has been solved!
Explore an expertly crafted, step-by-step solution for a thorough understanding of key concepts.

This is a popular solution!

Trending now
This is a popular solution!

Step by step
Solved in 4 steps

Recommended textbooks for you
Linear Algebra: A Modern Introduction
Algebra
ISBN:
9781285463247
Author:
David Poole
Publisher:
Cengage Learning
Linear Algebra: A Modern Introduction
Algebra
ISBN:
9781285463247
Author:
David Poole
Publisher:
Cengage Learning