The demand curve is P = 30-100p Draw the demand curve and label it The supply curve is P= 20 + 100s Draw the supply curve and label it Draw a point at the market equilibrium. >>> Make your curve intersect the y-axis 30- 10- Price 0.25 05 0.75 1.25 15 Quantity >>> Draw only the objects specified in the question
The demand curve is P = 30-100p Draw the demand curve and label it The supply curve is P= 20 + 100s Draw the supply curve and label it Draw a point at the market equilibrium. >>> Make your curve intersect the y-axis 30- 10- Price 0.25 05 0.75 1.25 15 Quantity >>> Draw only the objects specified in the question

Algebra & Trigonometry with Analytic Geometry
13th Edition
ISBN:9781133382119
Author:Swokowski
Publisher:Swokowski
Chapter9: Systems Of Equations And Inequalities
Section: Chapter Questions
Problem 13T

Related questions
Question
3
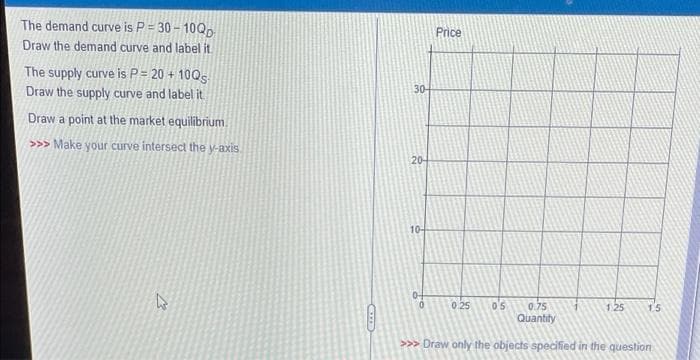
Transcribed Image Text:The demand curve is P = 30-10QD
Draw the demand curve and label it
The supply curve is P= 20 + 10Qs
Draw the supply curve and label it
Draw a point at the market equilibrium.
>>> Make your curve intersect the y-axis
k
30-
Price
20
10-
0
0.25 05
1.25 15
0.75
Quantity
>>> Draw only the objects specified in the question
Expert Solution
This question has been solved!
Explore an expertly crafted, step-by-step solution for a thorough understanding of key concepts.

Step by step
Solved in 2 steps with 2 images

Recommended textbooks for you
Algebra & Trigonometry with Analytic Geometry
Algebra
ISBN:
9781133382119
Author:
Swokowski
Publisher:
Cengage
Algebra & Trigonometry with Analytic Geometry
Algebra
ISBN:
9781133382119
Author:
Swokowski
Publisher:
Cengage