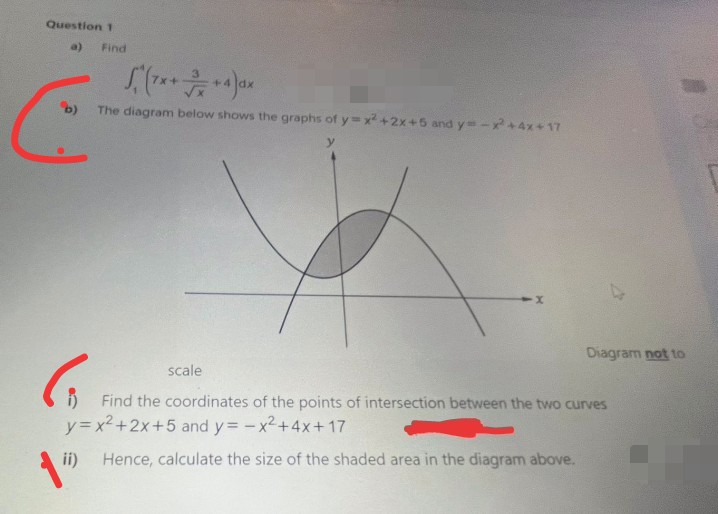
The diagram below shows the graphs of y x+2x+5 and y=-+4x+17 Diagram not to scale Find the coordinates of the points of intersection between the two curves y=x2 +2x+5 and y= -x2+4x+17 ii) Hence, calculate the size of the shaded area in the diagram above.
The diagram below shows the graphs of y x+2x+5 and y=-+4x+17 Diagram not to scale Find the coordinates of the points of intersection between the two curves y=x2 +2x+5 and y= -x2+4x+17 ii) Hence, calculate the size of the shaded area in the diagram above.

Algebra & Trigonometry with Analytic Geometry
13th Edition
ISBN:9781133382119
Author:Swokowski
Publisher:Swokowski
Chapter3: Functions And Graphs
Section3.3: Lines
Problem 7E

Related questions
Question
Solve this now plz b part i and ii that i highlighted by red pen plz solve all
Transcribed Image Text:Question 1
a)
Find
+4
The diagram below shows the graphs of y3x +2x+6 and y=-x+4x+ 17
Diagram not to
scale
Find the coordinates of the points of intersection between the two curves
y= x2+2x+5 and y= -x2+4x+ 17
ii)
Hence, calculate the size of the shaded area in the diagram above.
Expert Solution
This question has been solved!
Explore an expertly crafted, step-by-step solution for a thorough understanding of key concepts.

Step by step
Solved in 2 steps with 2 images

Recommended textbooks for you
Algebra & Trigonometry with Analytic Geometry
Algebra
ISBN:
9781133382119
Author:
Swokowski
Publisher:
Cengage
Algebra & Trigonometry with Analytic Geometry
Algebra
ISBN:
9781133382119
Author:
Swokowski
Publisher:
Cengage