The economic dependency ratio is defined as the number of persons in the total population who are not in the workforce per 100 in the workforce. Since 1960, baby boomers in the workforce and a decrease in the birth rate have caused a significant decrease in the economic dependency ratio. With data for selected years from 1960 and projected to 2050, the economic dependency ratio R can be modeled by the function R(x) = -0.0002x³ + 0.052x² – 4.06x + 192 where x is the number of years past 1950.† Use this model to find the year in which the economic dependency ratio reached its minimum. 109 What was happening in the United States around this time that helps explain why the minimum occurred in this year?
The economic dependency ratio is defined as the number of persons in the total population who are not in the workforce per 100 in the workforce. Since 1960, baby boomers in the workforce and a decrease in the birth rate have caused a significant decrease in the economic dependency ratio. With data for selected years from 1960 and projected to 2050, the economic dependency ratio R can be modeled by the function R(x) = -0.0002x³ + 0.052x² – 4.06x + 192 where x is the number of years past 1950.† Use this model to find the year in which the economic dependency ratio reached its minimum. 109 What was happening in the United States around this time that helps explain why the minimum occurred in this year?

Chapter6: Exponential And Logarithmic Functions
Section6.7: Exponential And Logarithmic Models
Problem 16TI: Recent data suggests that, as of 2013, the rate of growth predicted by Moore’s Law no longer holds....

Related questions

Question
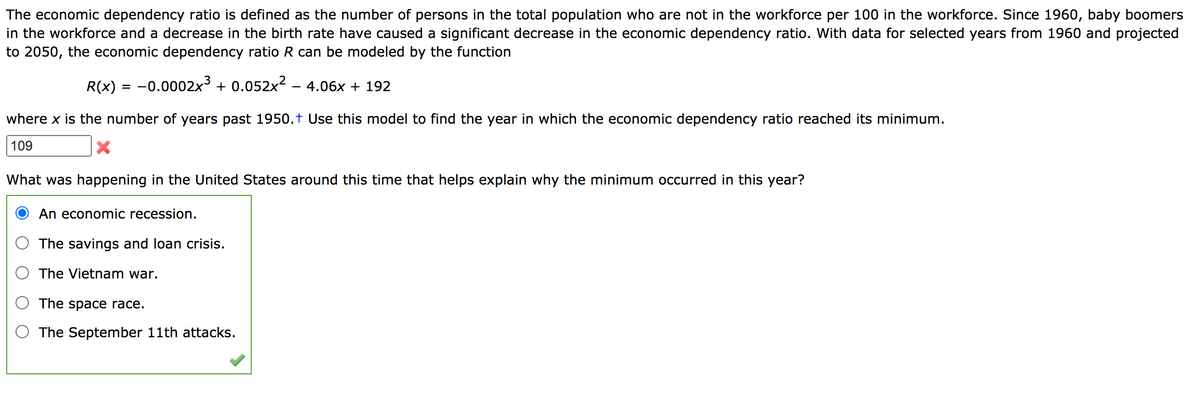
Transcribed Image Text:The economic dependency ratio is defined as the number of persons in the total population who are not in the workforce per 100 in the workforce. Since 1960, baby boomers
in the workforce and a decrease in the birth rate have caused a significant decrease in the economic dependency ratio. With data for selected years from 1960 and projected
to 2050, the economic dependency ratio R can be modeled by the function
R(x) = -0.0002x3 + 0.052x2 - 4.06x + 192
where x is the number of years past 1950.t Use this model to find the year in which the economic dependency ratio reached its minimum.
109
What was happening in the United States around this time that helps explain why the minimum occurred in this year?
An economic recession.
The savings and loan crisis.
The Vietnam war.
The space race.
The September 11th attacks.
Expert Solution
This question has been solved!
Explore an expertly crafted, step-by-step solution for a thorough understanding of key concepts.

This is a popular solution!

Trending now
This is a popular solution!

Step by step
Solved in 2 steps

Knowledge Booster


Learn more about
Need a deep-dive on the concept behind this application? Look no further. Learn more about this topic, calculus and related others by exploring similar questions and additional content below.Recommended textbooks for you

Glencoe Algebra 1, Student Edition, 9780079039897…
Algebra
ISBN:
9780079039897
Author:
Carter
Publisher:
McGraw Hill

Algebra and Trigonometry (MindTap Course List)
Algebra
ISBN:
9781305071742
Author:
James Stewart, Lothar Redlin, Saleem Watson
Publisher:
Cengage Learning
Glencoe Algebra 1, Student Edition, 9780079039897…
Algebra
ISBN:
9780079039897
Author:
Carter
Publisher:
McGraw Hill
Algebra and Trigonometry (MindTap Course List)
Algebra
ISBN:
9781305071742
Author:
James Stewart, Lothar Redlin, Saleem Watson
Publisher:
Cengage Learning

College Algebra
Algebra
ISBN:
9781305115545
Author:
James Stewart, Lothar Redlin, Saleem Watson
Publisher:
Cengage Learning

Algebra & Trigonometry with Analytic Geometry
Algebra
ISBN:
9781133382119
Author:
Swokowski
Publisher:
Cengage