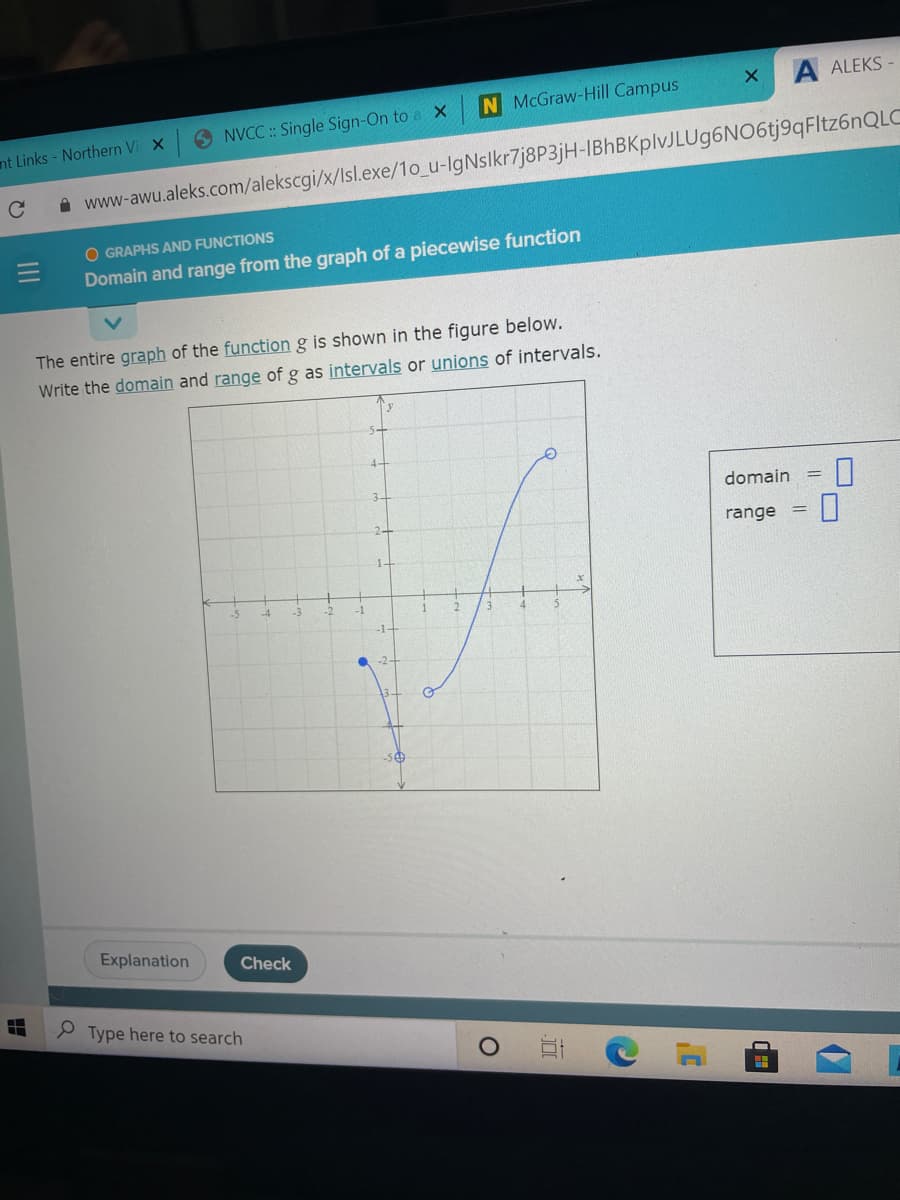
The entire graph of the function g is shown in Write the domain and range of g as intervals or unions of intervals. 3- domain !3! range %3D -5 -4 -1 3. -1+ -2구


Q: See attached
A: The domain of a function is the set of all real values of x that will give real values for y.The…
Q: The entire graph of the function h is shown in the figure below. Write the domain and range ofh as…
A: From the graph the domain x∈-4, -1 ∪1, 5
Q: The entire graph of the function g is shown in the figure below. Write the domain and range of g as…
A:
Q: The entire graph of the function g is shown in the figure below. Write the domain and range of g as…
A:
Q: Use possible symmetry to determine whether the given graph is the graph of an even function, an odd…
A: To use symmetry to find the graph of an even function, an odd function, or a function that is…
Q: Find the domain and range of the function graphed below. 5+ -543 -2 3 4 5 -2 -3 -4 -5+ Domain:…
A: Domain is the x values for which graph is defined Hence Domain = [-1 , 2)
Q: 4. Which graph best represents a function with a range of all real numbers greater than or equal to…
A: Given, A function with a range of all real numbers greater than or equal to -6.
Q: The entire graph of the function g is shown in the figure below. Write the domain and range of g as…
A:
Q: The graph of a function f is shown below. 4 3 2 4-3-2 -3
A:
Q: Graph a function f that satisfies all the following properties: A. The range of the function is…
A: Given : Range : [ -3 , 4 ] which means y value is from -3 to 4 Domain : [-5 , 7 ] which means x…
Q: Find the domain and range of the function graphed below. 5- 3- 2- -5 -4 -3 -2 4 5 -2- -4- -5+…
A:
Q: Find the domain and range of the function graphed below. 2. 1. -5 4-3 2 -1 -1 3. 4 -2 -3 -4 -5+…
A:
Q: -6 -5 4 -3 -2 -1 -2 -5 -- Write the range of the function using interval notation. Submit Question
A: The range of the function is the closed interval, [-5, -1]
Q: The entire graph of the function g is shown in the figure below. Write the domain and range of g…
A: For domain we have to see the x-axis. DOMAIN is (-3,3) For range we have to see the y-axis. RANGE is…
Q: -5- 4- 2- -6 -5 -4 -3 -2 -1 1 2 3 4 5 6 -2- -3- -4- -5- Write the range of the function using…
A: Please the answer below
Q: State whether each graph is an even, odd, or neither even nor odd function f(8) . f(4) = 62 -27 -7…
A: We will find out the required value.
Q: Give an example of a function with a finite number of elements in the domain, but a number over a…
A: Assume that, the domain of the function is a set of all people whose birthday is same to you (month…
Q: Consider the graph or 10 -10 10 -10 What is the domain of the function? O x< 2 O x2 2 O -4 < x < -2…
A: Given query is to find the domain of the function.
Q: Determine if the graph is a graph of a function. If so, is it one-to-one? y 8- 6+ 4+ -8 -6 -4 -2 이…
A:
Q: Find the domain and range of the function graphed below. 5- 63 -5 -4 -3 -2 -1 F-1 1 4 3 4 5 -2 -3 -4…
A: From the above graph, we observe that the function is defined for -1≤x<3 Therefore the Domain…
Q: Find the domain and range of the function graphed below. 2 -54-3 -2 -1 -1 4 3 4 5 -2 -3 -4- -5t…
A: We have to find the domain and range of the given graph. On a graph, a solid dot is used for a…
Q: The entire graph of the function h is shown in the figure below. Write the domain and range of h as…
A: Sketch of the function is given by
Q: Consider the graph of the function h(x) = -x^5 + 5x^3 - 4x - 1 illustrated below. a. Describes the…
A: The graph is given for the polynomial.
Q: Use possible symmetry to determine whether the graph is the graph of an even function, an odd…
A: Given query is to find that graph is a even function or odd function using symmetry.
Q: The entire graph of the function h is shown in the figure below. Write the domain and range of h as…
A: Given that: Graph of f(x)
Q: The entire graph of the function g is shown in the figure below. Write the domain and range of g as…
A: We have to find the domain and range for the given graph.
Q: Give the domain of the function in the graph. Give the range of the function in the graph.
A:
Q: 3. Find domain and range of the function whose graph is given in the following figure.
A: Given a graph of a function.
Q: Graph the function. Identify the domain, range and aysmptote
A:
Q: he domain and range of the function graph 5+ 2- -3 -2 -1 I 2 3 4 5 -2 -4 -5+ n: [-2,1) 3.
A:
Q: Which formula defines the piecewise-defined function whose graph is shown below? 3- 2 4-3
A: Let's analyze the given graph from left to right, since you need not worry about the function…
Q: Q2/ Graph the function bellow, write its Range and Domain, test if it is Odd or Even, and its…
A:
Q: A partial table of values is given for the function f(=). -3 Which graph could represent the…
A: Given, x -3 0 y 0 3
Q: Consider the function with the graph below. 1.0 -6 6 -6 (Click on graph to enlarge) What is the…
A:
Q: The entire graph of the functionf is shown in the figure below. Write the domain and range of f as…
A: Domain is defined as all the possible values of x for a function y=fx. Range is defined as all the…
Q: Consider the graph snown below. -8 6 -4 y 200 150 100 2 50 -50 -100- -150- 200 2 8 X -250 If the…
A: Consider the graph shown below. If the complete graph of the function is shown, then to estimate the…
Q: The entire graph of the function h is showl Write the domain and range of h using interval notation.…
A: We can find the domain and range of the given graph as below.
Q: The entire graph of the function h is shown in the figure below. Write the domain and range of h as…
A: Given, the graph of the function h. Need to find the domain and range of h.
Q: Consider the function with the graph below. 1.0 100 -6 6 -6 (Click on graph to enlarge) What is the…
A:
Q: use graphing software to determine which of thegiven viewing windows displays the most appropriate…
A: given function: fx=5+12x-x3 viewing windows:
Q: Questlon 9 of 10 Using the graph as your guide, complete the following statement. The discriminant…
A:
Q: The entire graph of the function h is shown in the figure below. Write the domain and range of h as…
A: From the given find , find Domain and Range in the interval form.
Q: The entire graph of the function g is shown in the figure below. Write the domain and range of g as…
A:
Q: The entire graph of the function g is shown in the figure below. Write the domain and range of g as…
A: We have to find out the domain and range
Q: Consider the function with the graph below. 1.8 1.0 -6 -6 (Click on graph to enlarge) What is the…
A:
Q: The entire graph of the function h is shown in the figure below. Write the domain and range of h as…
A: Range of the function is the how long distance covered by graph of y axis.
Q: See attached
A: The domain is the set of all values on x-axis which lies on the given curve and range is the set of…
Q: The graph of the function f (x) is shown below. State all values of x in the open interval -9 < < 9…
A: SOLUTION: We have to determine jump discontinuity in given graph Jump discontinuity is when the two…
Q: Use the graph of the function to find its domain and range. Write the domain and range in interval…
A:
Q: The graph of the absolute value parent function, fx) = [x, is stretched horizontally by a factor of…
A: Stretching of a function has very simple mean. If f(x) has to be stretched with a factor a that…


Trending now
This is a popular solution!

Step by step
Solved in 2 steps with 1 images


- Although the Hungarian method is an efficient methodfor solving an assignment problem, the branch-and-boundmethod can also be used to solve an assignment problem.Suppose a company has five factories and five warehouses.Each factory’s requirements must be met by a singlewarehouse, and each warehouse can be assigned to only onefactory. The costs of assigning a warehouse to meet afactory’s demand (in thousands) are shown in Table 77.Let xij 1 if warehouse i is assigned to factory j and 0otherwise. Begin by branching on the warehouse assigned tofactory 1. This creates the following five branches: x11 1,x21 1, x31 1, x41 1, and x51 1. How can we obtaina lower bound on the total cost associated with a branch?Examine the branch x21 1. If x21 1, no furtherassignments can come from row 2 or column 1 of the costmatrix. In determining the factory to which each of theunassigned warehouses (1, 3, 4, and 5) is assigned, we cannotdo better than assign each to the smallest cost in…the coordinates of the vertices in the image: Reflect pre-image QRST across the x-axis.The authors of a paper compared two different methods for measuring body fat percentage. One method uses ultrasound, and the other method uses X-ray technology. Body fat percentages using each of these methods for 16 athletes (a subset of the data given in a graph that appeared in the paper) are given in the accompanying table. You can assume that the 16 athletes who participated in this study are representative of the population of athletes. Athlete X-ray Ultrasound 1 5.00 4.25 2 16.00 12.75 3 9.25 9.00 4 12.00 11.75 5 17.25 17.00 6 29.50 27.50 7 5.50 6.50 8 6.00 6.75 9 8.00 8.75 10 9.50 10.50 11 9.25 9.50 12 11.00 12.00 13 12.00 12.25 14 14.00 15.50 15 17.00 18.00 16 18.00 18.25 Use these data to estimate the difference in mean body fat percentage measurement for the two methods. Use a confidence level of 95%. (Use ?d = ?X-ray − ?ultrasound. Round your answers to three decimal places.) , % Interpret the interval in context.…
- For (c): optons are: saddle point, relative maximum, relative minimum, and inconclusiveSocaccio Pistachio, Inc. makes two types of pistachio nuts: Dazzling Red and Organic. Pistachio nuts require food color and salt, and the following table shows the amount of food color and salt required fo a 1-kilogram batch of pistachios as well as the total amount of these ingridients available each day: Use a graph to show the possible numbers of batches of each type of pistachio Socaccio can produce each day. Dazzling Red Organic Total Available Food color(grams) 2 1 20 Salt(grams) 10 20 220The authors of a paper compared two different methods for measuring body fat percentage. One method uses ultrasound, and the other method uses X-ray technology. Body fat percentages using each of these methods for 16 athletes (a subset of the data given in a graph that appeared in the paper) are given in the accompanying table. You can assume that the 16 athletes who participated in this study are representative of the population of athletes. Athlete X-ray Ultrasound 1 5.00 4.25 2 12.00 8.75 3 9.25 9.00 4 12.00 11.75 5 17.25 17.00 6 29.50 27.50 7 5.50 6.50 8 6.00 6.75 9 8.00 8.75 10 9.50 10.50 11 9.25 9.50 12 11.00 12.00 13 12.00 12.25 14 14.00 15.50 15 17.00 18.00 16 18.00 18.25 Use these data to estimate the difference in mean body fat percentage measurement for the two methods. Use a confidence level of 95%. (Use ?d = ?X-ray − ?ultrasound. Round your answers to three decimal places.) , % Interpret the interval in…
- Need some heplp with these graphsThe authors of a paper compared two different methods for measuring body fat percentage. One method uses ultrasound, and the other method uses X-ray technology. Body fat percentages using each of these methods for 16 athletes (a subset of the data given in a graph that appeared in the paper) are given in the accompanying table. You can assume that the 16 athletes who participated in this study are representative of the population of athletes. Athlete X-ray Ultrasound 1 5.00 4.50 2 15.00 11.75 3 9.25 9.00 4 12.00 11.75 5 17.25 17.00 6 29.50 27.50 7 5.50 6.50 8 6.00 6.75 9 8.00 8.75 10 16.50 17.50 11 9.25 9.50 12 11.00 12.00 13 12.00 12.25 14 14.00 15.50 15 17.00 18.00 16 18.00 18.25 Use these data to estimate the difference in mean body fat percentage measurement for the two methods. Use a confidence level of 95%. (Use ?d = ?X-ray − ?ultrasound. Round your answers to three decimal places.) , % Interpret the interval in…does planar graph of order 4 has an example? How about nonplanar graph of order 4? Can you give example? If there's none, please explain why