The estimated world population was 3.5 billion in 1953 and 8.1 billion in 2013. Find the increase in population, the percent increase, and find the ratio of the 2013 population to the 1953 population as a percent. The population increased by billion people The population increased by % The population in 2013 was % of what it was in 1953.
The estimated world population was 3.5 billion in 1953 and 8.1 billion in 2013. Find the increase in population, the percent increase, and find the ratio of the 2013 population to the 1953 population as a percent. The population increased by billion people The population increased by % The population in 2013 was % of what it was in 1953.

ChapterP2: Part 2: Exchange Rate Behavior
Section: Chapter Questions
Problem 3Q

Related questions

Concept explainers
Question
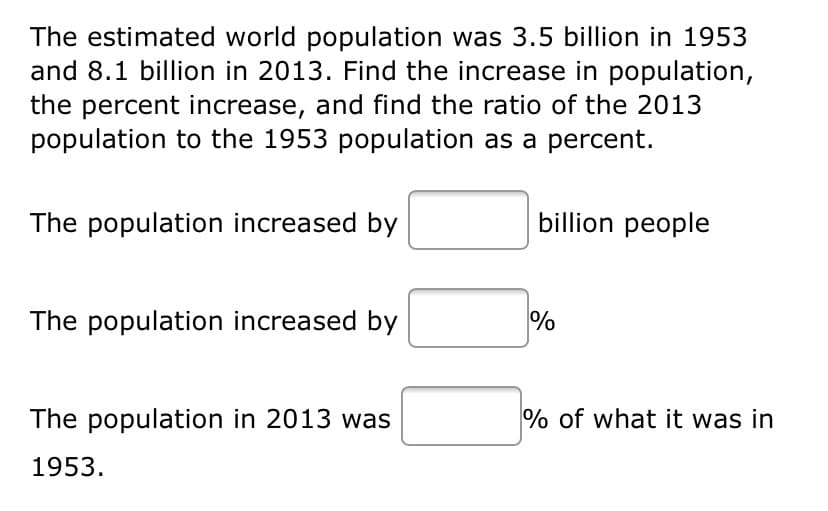
Transcribed Image Text:The estimated world population was 3.5 billion in 1953
and 8.1 billion in 2013. Find the increase in population,
the percent increase, and find the ratio of the 2013
population to the 1953 population as a percent.
The population increased by
billion people
The population increased by
The population in 2013 was
% of what it was in
1953.
Expert Solution
This question has been solved!
Explore an expertly crafted, step-by-step solution for a thorough understanding of key concepts.

This is a popular solution!

Trending now
This is a popular solution!

Step by step
Solved in 3 steps with 2 images

Knowledge Booster


Learn more about
Need a deep-dive on the concept behind this application? Look no further. Learn more about this topic, finance and related others by exploring similar questions and additional content below.Recommended textbooks for you

Essentials Of Business Analytics
Statistics
ISBN:
9781285187273
Author:
Camm, Jeff.
Publisher:
Cengage Learning,
Essentials Of Business Analytics
Statistics
ISBN:
9781285187273
Author:
Camm, Jeff.
Publisher:
Cengage Learning,