
College Algebra
7th Edition
ISBN:9781305115545
Author:James Stewart, Lothar Redlin, Saleem Watson
Publisher:James Stewart, Lothar Redlin, Saleem Watson
Chapter2: Functions
Section2.4: Average Rate Of Change Of A Function
Problem 2E

Related questions
Question
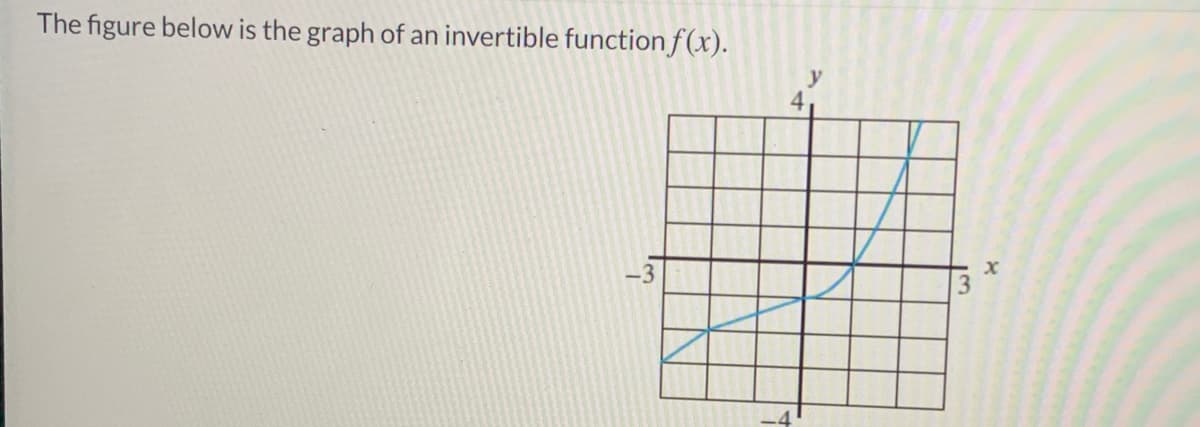
Transcribed Image Text:The figure below is the graph of an invertible function f(x).
3.
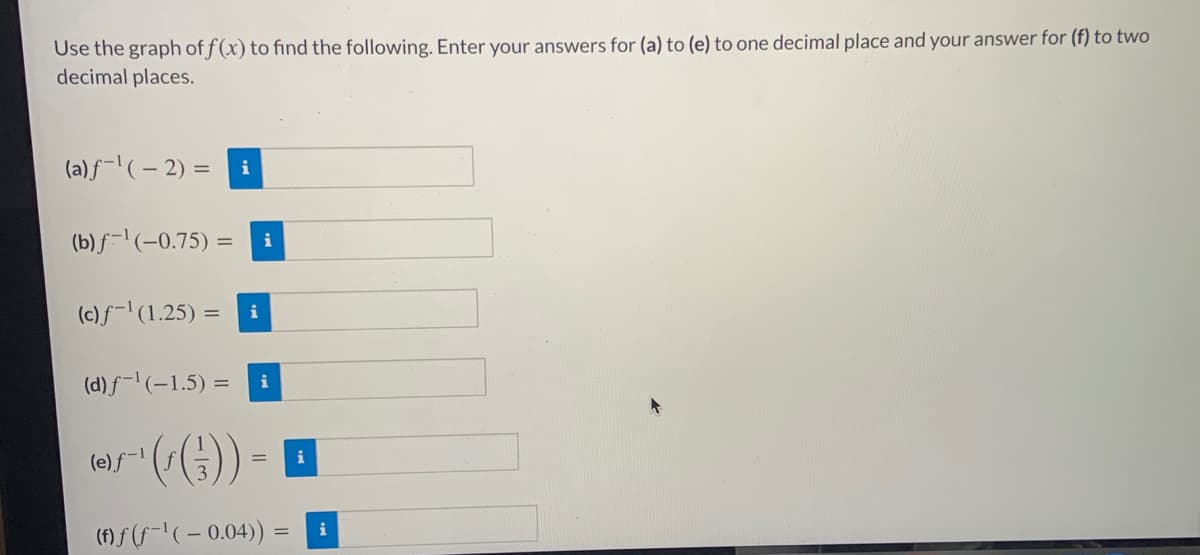
Transcribed Image Text:Use the graph of f (x) to find the following. Enter your answers for (a) to (e) to one decimal place and your answer for (f) to two
decimal places.
(a)f-'(- 2) = i
(b) f-' (-0.75) =
i
(c)f-'(1.25) =
i
(d) f-(-1.5) =
i
(e) f-1
i
(f) F (F=" ( – 0.04))
i
Expert Solution
This question has been solved!
Explore an expertly crafted, step-by-step solution for a thorough understanding of key concepts.

This is a popular solution!

Trending now
This is a popular solution!

Step by step
Solved in 4 steps with 2 images

Knowledge Booster


Learn more about
Need a deep-dive on the concept behind this application? Look no further. Learn more about this topic, calculus and related others by exploring similar questions and additional content below.Recommended textbooks for you
College Algebra
Algebra
ISBN:
9781305115545
Author:
James Stewart, Lothar Redlin, Saleem Watson
Publisher:
Cengage Learning
College Algebra
Algebra
ISBN:
9781305115545
Author:
James Stewart, Lothar Redlin, Saleem Watson
Publisher:
Cengage Learning