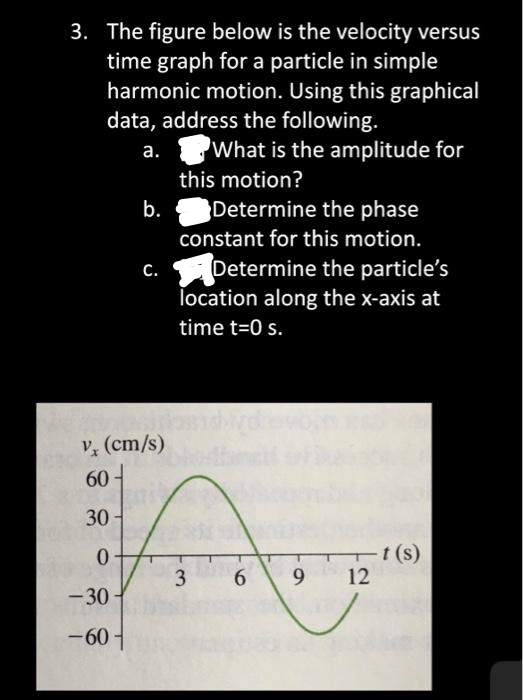
The figure below is the velocity versus time graph for a particle in simple harmonic motion. Using this graphical data, address the following. a. What is the amplitude for this motion? Determine the phase constant for this motion. b. c. Determine the particle's location along the x-axis at time t=0 s.

Q: After solving a difficult physics problem, an excited student throws his book straight up. It leaves…
A:
Q: Please solve all the parts below and show work and explain so i can understand how to do the…
A:
Q: Two masses, m₁ = 65 kg, and m₂ = 81 kg are attached by a massless rope over a massless, frictionless…
A:
Q: 29 Go Figure 20-27 shows a re- versible cycle through which 1.00 mol of a monatomic ideal gas is…
A: As per our guidelines, we can answer only 3 subparts. Please resubmit remaining parts.
Q: Suppose a pendulum has a length L and period T on earth. If you take it to a planet where the…
A: The time period of simple pendulum is dependent on length and acceleration due to gravity. This is…
Q: 1. Calculate the weight in newtons and in lbf of an average person on the Earth.
A: Disclaimer: Since you have asked multiple questions, we will solve the first question for you. If…
Q: Which of the following statements about the Gibbs function (Gibbs free energy) are generally true?…
A: The Gibbs free energy (G) is a thermodynamic function that combines the enthalpy (H) and entropy (S)…
Q: Suppose that a wind is blowing in the direction S45°E at a speed of 50 km/h. A pilot is steering a…
A:
Q: Question 5 B global and local maximum A local minimum a. For a maxima, O b. For a maxima, In the…
A: Have a look dear
Q: In the figure two tiny conducting balls of identical mass m and identical charge q hang from…
A: Given data : Length of thread L = 170 cm Mass of tiny charge q = 14 g Distance between two tiny…
Q: Electronics and inhabitants of the International Space Station generate a significant amount of…
A: We are given working temperature of panels. We are also given dimensions of panel. We find area…
Q: A plane leaves Seattle, flies 85.0 mimi at 20.0 ∘∘ north of east, and then changes direction to 51.0…
A: We are given the displacements of plane. We are given magnitude of each displacement and the…
Q: A wave has peaks and troughs that can move matter up and down when the wave interacts with matter.…
A: The problems are based on the concepts of wavelength, frequency, and speed. Wavelength is the…
Q: Fast pls i will give u like for sure pls solve this question correctly in 5 min pls 1You want to…
A: Disclaimer: “Since you have asked multiple question, we will solve the first question for you. If…
Q: P2.7 By evaluating the integral w = - Pext dV, calculate th work done in each of the cycles shown…
A:
Q: 3. The following plots show a one dimensional harmonic wave at two different moments in time: f (cm)…
A: Given two graphs of a one-dimensional harmonic wave, the two plots are known as the snapshot of a…
Q: Question 1 L + + + + + + + + + P 8.10 nC of charge is uniformly distributed along a thin rod of…
A: Since you have asked multiple questions, we will solve the first question for you. If you want any…
Q: A square loop 13.0 cm on a side has a resistance of 5.45 \Omega. It is initially in a 0.380 T…
A: Given: Length of square loop is 13 cm Area can be square of length A=L2A=0.13 m2A=0.0169 m2…
Q: 4. For the function 2-1 z³(z − 2) 1 (4) find the first few terms of the Laurent series about the…
A: Since we know that residue at origin means at z=0 is coefficient of 1/z.
Q: Shown are three main sequence stars. Each one is a different size, but the color is not shown. Rank…
A: Given in the question are 3 main sequence stars. Each one has a different size. We need to rank them…
Q: Two test charges are located in the x-y plane. If q₁ = -3.200 nC and is located at x₁ = 0.00 m, y₁ =…
A: We are given 2 charges. We are given their positions from origin. We find distances of charge from…
Q: What are the a- and b-components? Solve and apply the triangle rule. Show your complete solution.…
A: We are given the force vector. We are given magnitude of force. We have to find component along the…
Q: LC-5 A line of length L with constant linear charge density +(C/m) lies on the x axis. A point P…
A:
Q: A brass bolt is used to connect two brass plates together. The bolt must withstand shear forces up…
A: Given: Force is 3310 N Safety factor is 5
Q: A metal rod 1 m long rotates about one end in the plane perpendicular to a uniform magnetic field of…
A: We need to find- Induced emf (e)=? The data given as- l=1 m B=0.38 x 10⁻⁴ Wb/m2 n=720 rpm=72060=12…
Q: If the experimental Cr Value at a temperature 207k For a diamond Crystal is 2.685 /mol. K Calculate…
A: For diamond the Einstein temperature is 1450 K and the Debye temperature is 1860 K.
Q: A small cube of iron is observed under a microscope. The edge of the The atomic mass of iron is…
A: Given data, Atomic mass of iron M = 55.845 u. Density of cube ρ=7.86 g/cm3. Length of edge of cube…
Q: 3. The following plots show a one dimensional harmonic wave at two different moments in time: f (cm)…
A: Given Data: Let us consider the given data, t=0s and t=5s. To determine the direction in which the…
Q: Can any of these be classified as visible radiation? Determine the optimal course of action. t) Put…
A: The electromagnetic spectrum is the range of frequencies (the spectrum) of electromagnetic radiation…
Q: A ball is thrown into the air at an angle of 60 above the horizontal with an initial velocity of 40…
A: We are given initial velocity of ball. We are also given the angle from horizontal at which ball is…
Q: When a force Facts on an object at some distance r from a point P, called the pivot point, it can…
A: Concept: To determine the Torque about P will use the Formula τ=r×Fwhere,τ=Torquer=RadiusF=Force…
Q: What is the inductance of a coil if it produces an emf of 8.46V when the current in it changes from…
A: Given: Current ranges from -28.3 mA to 33.2 mA emf is 8.46 V
Q: Determine the a and b components. Show your correct and complete solution. Thank you.
A: We are given the force vector. We are given magnitude of force. We have to find component along the…
Q: Which of the following describes a wave propagating along the positive X axis?
A:
Q: Light begin an EM wave does not obey Maxwell equations. Select one: O True O False
A: Concept introduction: Maxwell's equations are a set of four partial differential equations that…
Q: What are the two mechanisms by which x-rays are produced? a. Coherent scattering and photoelectric…
A: Disclaimer: Since you have asked multiple question, we will solve the first question for you. If you…
Q: The longest wavelength that can eject O photoelectrons from platinum is 1950 A. Calculate its work…
A: We need to find- Work function (Wo)=? The data given as- Longest wavelength λ0=1950 A0 λ0=1950×10-10…
Q: A container is divided into two equal volumes by a very thin membrane. It is held at a fixed…
A: Given: A container is divided by a thin membrane into two equal volumes. The temperature is…
Q: *In the circuit shown in Fig.5, the magnitude circuit impedance is 15/0° V 1,=2mA R 70 I=1.5mA
A: Given data, Given circuit diagram is,
Q: How many distinct systems are there in total?
A: To compute: The number of distinct systems in total.
Q: In the figure below, the rod moves to the right with a speed of1.8m/s, and has a resistance of 2.2?.…
A: Given: Speed is 1.8 m/s Resistance is 2.2 ohm Rail separation is 25 cm magnetic field is 0.33 T…
Q: In "The Color Purple" by Alice Walker, how is Nettie and Samuel's relationship
A: Samuel inspired Israel to a great victory over the Philistines at Ebenezer. She ends up going to…
Q: While passing between Earth and the Moon, a spacecraft is momentarily located on the line connecting…
A: We are given a spacecraft on the line joining antenna and moon. We are given its distance from…
Q: The work required to move a charge q along a circle of radius R in the center of which there is a…
A: Given, a charge q is moving around a circular path of radius R with a charge Q placed at its…
Q: While Mr. B's space station (m=4550. kg) is in circular orbit around Mars. He decides he wants a…
A: Given data: Mass of the space station, M= 4550 kg Mass of the planet mars. Mmars = 6.36 × 10²³kg The…
Q: An ideal step-down transformer has a primary coil of 370 turns and a secondary coil of 27 turns. Its…
A: Np - is the Number of Primary Windings Ns - is the Number of Secondary Windings Vp - is the Primary…
Q: 30. In a pipe system 2 pipes join in a third pipe. Water flows in the first two pipes at a flow rate…
A:
Q: A particle (charge +13.3 pC) is located on the x-axis at x = 18,7 cm, and a second particle (charge…
A:
Q: Which of the following units of measurement can express electrical conductivity (or specific…
A:
Q: What are the factors that define the transmission capacity of power lines, and how (3 factors).
A: There may be many factors that can define the transmission capacity of power lines. Some are…

Step by step
Solved in 3 steps with 3 images
