The figure below shows the graph and data of the movement of two bodies. Sequence 1 is the data for body 1 and sequence 2 is the data for body 2. In the table, the first column is the time in seconds, the second and third are the positions of body 1 and 2, respectively, in meters. a) Which data sequence has the highest instantaneous speed? 1 or 2? b) In sequence 1, in which second is the instantaneous speed closest to 0m / s? c) In the interval of 4 to 9s, what is the average speed of body 1? d) In the interval from 4 to 9 seconds, what is the average speed of body 2?
The figure below shows the graph and data of the movement of two bodies. Sequence 1 is the data for body 1 and sequence 2 is the data for body 2. In the table, the first column is the time in seconds, the second and third are the positions of body 1 and 2, respectively, in meters. a) Which data sequence has the highest instantaneous speed? 1 or 2? b) In sequence 1, in which second is the instantaneous speed closest to 0m / s? c) In the interval of 4 to 9s, what is the average speed of body 1? d) In the interval from 4 to 9 seconds, what is the average speed of body 2?

Related questions
Question
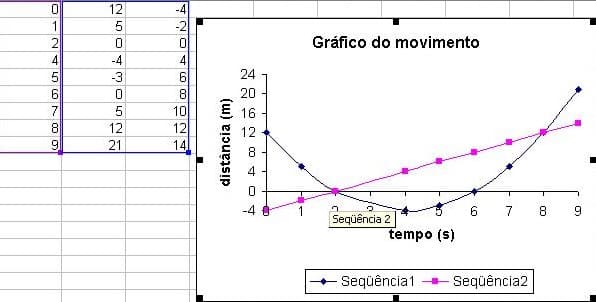
The figure below shows the graph and data of the movement of two bodies. Sequence 1 is the data for body 1 and sequence 2 is the data for body 2. In the table, the first column is the time in seconds, the second and third are the positions of body 1 and 2, respectively, in meters.
a) Which data sequence has the highest instantaneous speed? 1 or 2?
b) In sequence 1, in which second is the instantaneous speed closest to 0m / s?
c) In the interval of 4 to 9s, what is the average speed of body 1?
d) In the interval from 4 to 9 seconds, what is the average speed of body 2?
Transcribed Image Text:12
1
-2
Gráfico do movimento
4
-3
6
24
8
20
10
E 16
12
12
9
21
14
-4 0
6 7 8
Seqüência 2
tempo (s)
-Seqüência1
Seqüência2
distância (m)
N504MO52
245 O700
Expert Solution
This question has been solved!
Explore an expertly crafted, step-by-step solution for a thorough understanding of key concepts.

Step by step
Solved in 2 steps
