The figure shows a series of varying metals rigidly attached to each other. Axial loads and their positions are shown to be acting on the component metals. Calculate the value of P that shall be limited to the following values: • For aluminum 100 MPa • For bronze: = 110 MPa • For streel: = 150 MPa Aluminum: L=2.5m; A = 350 mm? Steel: L = 3,0m; A = Bronze: L = 2.0m A = %3D 450 mm? 250 mm? 3.75P 3.50P 2.75P
The figure shows a series of varying metals rigidly attached to each other. Axial loads and their positions are shown to be acting on the component metals. Calculate the value of P that shall be limited to the following values: • For aluminum 100 MPa • For bronze: = 110 MPa • For streel: = 150 MPa Aluminum: L=2.5m; A = 350 mm? Steel: L = 3,0m; A = Bronze: L = 2.0m A = %3D 450 mm? 250 mm? 3.75P 3.50P 2.75P

Materials Science And Engineering Properties
1st Edition
ISBN:9781111988609
Author:Charles Gilmore
Publisher:Charles Gilmore
Chapter14: Material Selection
Section: Chapter Questions
Problem 3CQ

Related questions
Question
give the complete solution to the given problem and show the free body diagram.
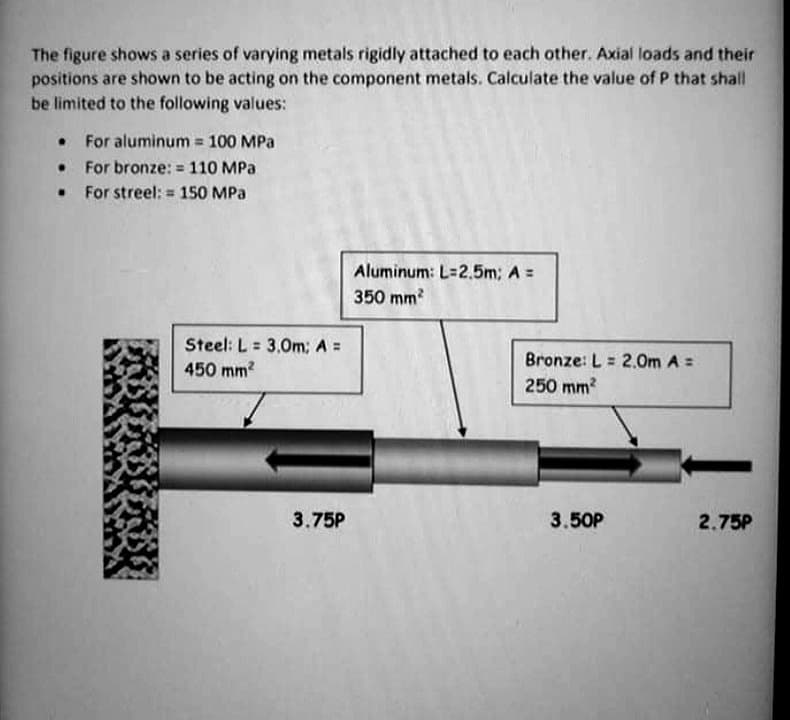
Transcribed Image Text:The figure shows a series of varying metals rigidly attached to each other. Axial loads and their
positions are shown to be acting on the component metals. Calculate the value of P that shall
be limited to the following values:
• For aluminum 100 MPa
• For bronze: 110 MPa
• For streel: = 150 MPa
Aluminum: L=2.5m; A =
350 mm
Steel: L = 3,0m; A =
%3!
Bronze: L = 2.0m A =
%3D
450 mm?
250 mm?
3.75P
3.50P
2.75P
Expert Solution
This question has been solved!
Explore an expertly crafted, step-by-step solution for a thorough understanding of key concepts.

Step by step
Solved in 2 steps with 2 images

Knowledge Booster


Learn more about
Need a deep-dive on the concept behind this application? Look no further. Learn more about this topic, civil-engineering and related others by exploring similar questions and additional content below.Recommended textbooks for you
Materials Science And Engineering Properties
Civil Engineering
ISBN:
9781111988609
Author:
Charles Gilmore
Publisher:
Cengage Learning
Materials Science And Engineering Properties
Civil Engineering
ISBN:
9781111988609
Author:
Charles Gilmore
Publisher:
Cengage Learning