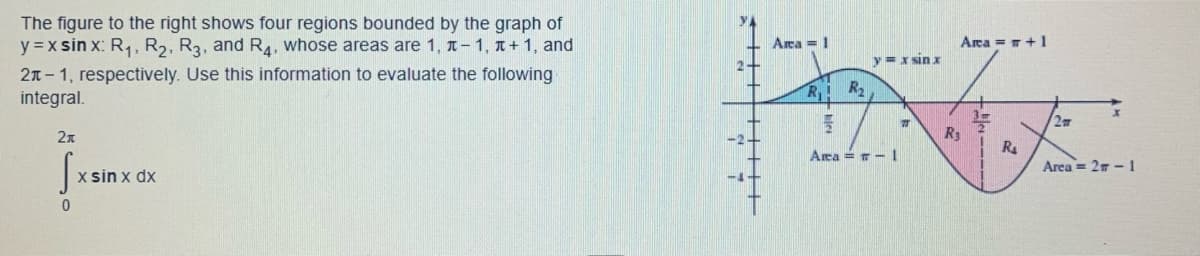
The figure to the right shows four regions bounded by the graph of y=xsin x: R₁, R₂, R3, and R4, whose areas are 1, à-1, +1, and 2-1, respectively. Use this information to evaluate the following integral. 2x S 0 x sin x dx +++++ Area = 1 R₂ y = x sin x R.1 15 Area = -1 77 Area = +1 R₁ R₁ 2T x Area = 2-1
The figure to the right shows four regions bounded by the graph of y=xsin x: R₁, R₂, R3, and R4, whose areas are 1, à-1, +1, and 2-1, respectively. Use this information to evaluate the following integral. 2x S 0 x sin x dx +++++ Area = 1 R₂ y = x sin x R.1 15 Area = -1 77 Area = +1 R₁ R₁ 2T x Area = 2-1

Algebra & Trigonometry with Analytic Geometry
13th Edition
ISBN:9781133382119
Author:Swokowski
Publisher:Swokowski
Chapter9: Systems Of Equations And Inequalities
Section: Chapter Questions
Problem 12T

Related questions
Question
Complete all please
Transcribed Image Text:The figure to the right shows four regions bounded by the graph of
y=xsin x: R₁, R₂, R3, and R4, whose areas are 1, î– 1, +1, and
2-1, respectively. Use this information to evaluate the following
integral.
2x
S
0
x sin x dx
+++++
Area = 1
R₁
R₂
y = x sin x
Area = -1
77
R
Area = +1
R₁
2T
x
Area = 2m-1
Expert Solution
This question has been solved!
Explore an expertly crafted, step-by-step solution for a thorough understanding of key concepts.

Step by step
Solved in 2 steps with 2 images

Recommended textbooks for you
Algebra & Trigonometry with Analytic Geometry
Algebra
ISBN:
9781133382119
Author:
Swokowski
Publisher:
Cengage
Algebra & Trigonometry with Analytic Geometry
Algebra
ISBN:
9781133382119
Author:
Swokowski
Publisher:
Cengage