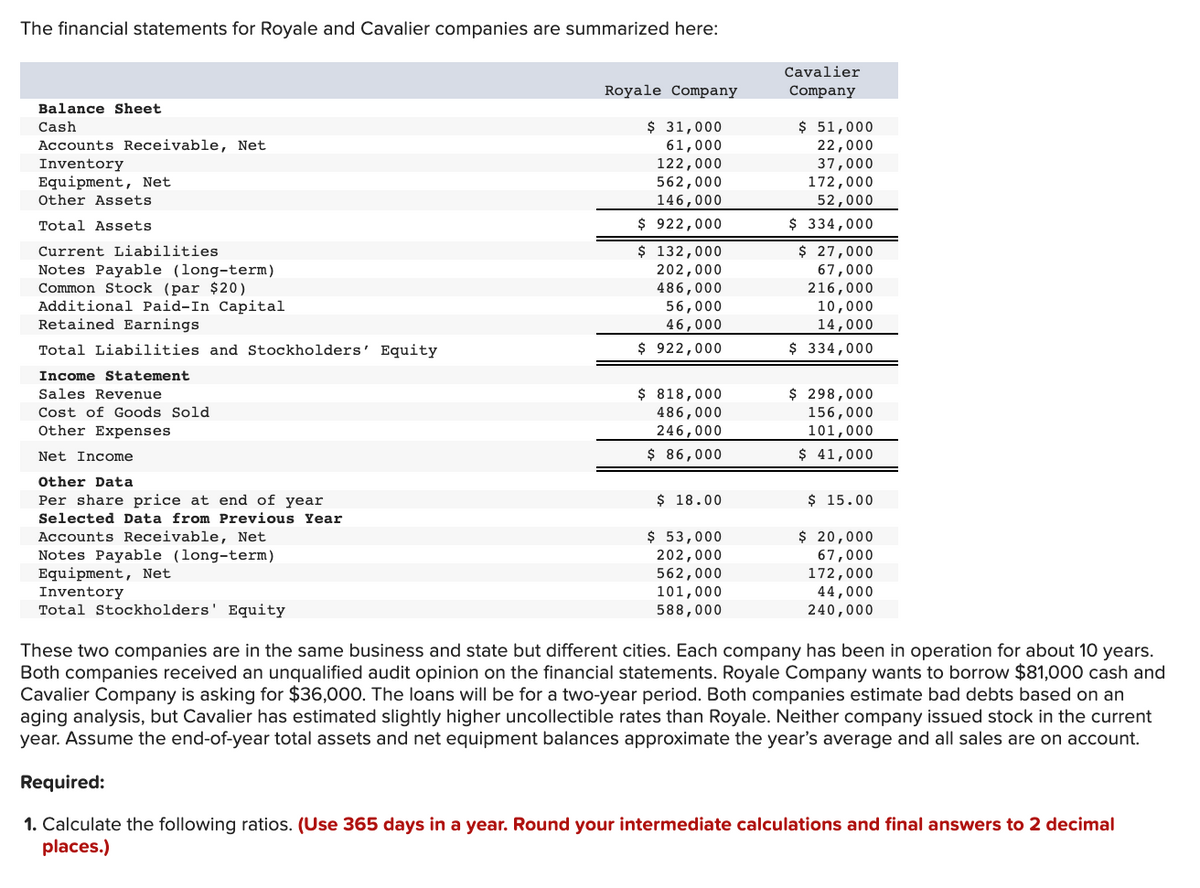
The financial statements for Royale and Cavalier companies are summarized here: Cavalier Royale Company Company Balance Sheet Cash Accounts Receivable, Net Inventory Equipment, Net $ 31,000 61,000 122,000 562,000 146,000 $ 51,000 22,000 37,000 172,000 52,000 Other Assets Total Assets $ 922,000 $ 334,000 $ 132,000 202,000 486,000 $ 27,000 67,000 216,000 10,000 14,000 Current Liabilities Notes Payable (long-term) Common Stock (par $20) Additional Paid-In Capital Retained Earnings 56,000 46,000 Total Liabilities and Stockholders' Equity $ 922,000 $ 334,000 Income Statement $ 818,000 486,000 246,000 $ 86,000 $ 298,000 156,000 101,000 Sales Revenue Cost of Goods Sold Other Expenses Net Income $ 41,000 Other Data Per share price at end of year $ 18.00 $ 15.00 Selected Data from Previous Year $ 53,000 Accounts Receivable, Net Notes Payable (long-term) Equipment, Net Inventory Total Stockholders' Equity 202,000 562,000 101,000 588,000 $ 20,000 67,000 172,000 44,000 240,000 These two companies are in the same business and state but different cities. Each company has been in operation for about 10 years. Both companies received an unqualified audit opinion on the financial statements. Royale Company wants to borrow $81,000 cash and Cavalier Company is asking for $36,000. The loans will be for a two-year period. Both companies estimate bad debts based on an aging analysis, but Cavalier has estimated slightly higher uncollectible rates than Royale. Neither company issued stock in the current year. Assume the end-of-year total assets and net equipment balances approximate the year's average and all sales are on account. Required: 1. Calculate the following ratios. (Use 365 days in a year. Round your intermediate calculations and final answers to 2 decimal places.)
The financial statements for Royale and Cavalier companies are summarized here: Cavalier Royale Company Company Balance Sheet Cash Accounts Receivable, Net Inventory Equipment, Net $ 31,000 61,000 122,000 562,000 146,000 $ 51,000 22,000 37,000 172,000 52,000 Other Assets Total Assets $ 922,000 $ 334,000 $ 132,000 202,000 486,000 $ 27,000 67,000 216,000 10,000 14,000 Current Liabilities Notes Payable (long-term) Common Stock (par $20) Additional Paid-In Capital Retained Earnings 56,000 46,000 Total Liabilities and Stockholders' Equity $ 922,000 $ 334,000 Income Statement $ 818,000 486,000 246,000 $ 86,000 $ 298,000 156,000 101,000 Sales Revenue Cost of Goods Sold Other Expenses Net Income $ 41,000 Other Data Per share price at end of year $ 18.00 $ 15.00 Selected Data from Previous Year $ 53,000 Accounts Receivable, Net Notes Payable (long-term) Equipment, Net Inventory Total Stockholders' Equity 202,000 562,000 101,000 588,000 $ 20,000 67,000 172,000 44,000 240,000 These two companies are in the same business and state but different cities. Each company has been in operation for about 10 years. Both companies received an unqualified audit opinion on the financial statements. Royale Company wants to borrow $81,000 cash and Cavalier Company is asking for $36,000. The loans will be for a two-year period. Both companies estimate bad debts based on an aging analysis, but Cavalier has estimated slightly higher uncollectible rates than Royale. Neither company issued stock in the current year. Assume the end-of-year total assets and net equipment balances approximate the year's average and all sales are on account. Required: 1. Calculate the following ratios. (Use 365 days in a year. Round your intermediate calculations and final answers to 2 decimal places.)

Managerial Accounting
15th Edition
ISBN:9781337912020
Author:Carl Warren, Ph.d. Cma William B. Tayler
Publisher:Carl Warren, Ph.d. Cma William B. Tayler
Chapter16: Financial Statement Analysis
Section: Chapter Questions
Problem 4PB

Related questions
Question
Transcribed Image Text:The financial statements for Royale and Cavalier companies are summarized here:
Cavalier
Royale Company
Company
Balance Sheet
$ 31,000
61,000
122,000
562,000
146,000
$ 51,000
22,000
37,000
172,000
52,000
Cash
Accounts Receivable, Net
Inventory
Equipment, Net
Other Assets
Total Assets
$ 922,000
$ 334,000
$ 27,000
$ 132,000
202,000
486,000
56,000
46,000
Current Liabilities
Notes Payable (long-term)
Common Stock (par $20)
Additional Paid-In Capital
Retained Earnings
67,000
216,000
10,000
14,000
Total Liabilities and Stockholders' Equity
$ 922,000
$ 334,000
Income Statement
$ 298,000
$ 818,000
486,000
246,000
Sales Revenue
Cost of Goods Sold
156,000
101,000
Other Expenses
Net Income
$ 86,000
$ 41,000
Other Data
Per share price at end of year
$ 18.00
$ 15.00
Selected Data from Previous Year
$ 53,000
202,000
562,000
101,000
588,000
$ 20,000
Accounts Receivable, Net
Notes Payable (long-term)
Equipment, Net
67,000
172,000
44,000
240,000
Inventory
Total Stockholders' Equity
These two companies are in the same business and state but different cities. Each company has been in operation for about 10 years.
Both companies received an unqualified audit opinion on the financial statements. Royale Company wants to borrow $81,000 cash and
Cavalier Company is asking for $36,000. The loans will be for a two-year period. Both companies estimate bad debts based on an
aging analysis, but Cavalier has estimated slightly higher uncollectible rates than Royale. Neither company issued stock in the current
year. Assume the end-of-year total assets and net equipment balances approximate the year's average and all sales are on account.
Required:
1. Calculate the following ratios. (Use 365 days in a year. Round your intermediate calculations and final answers to 2 decimal
places.)
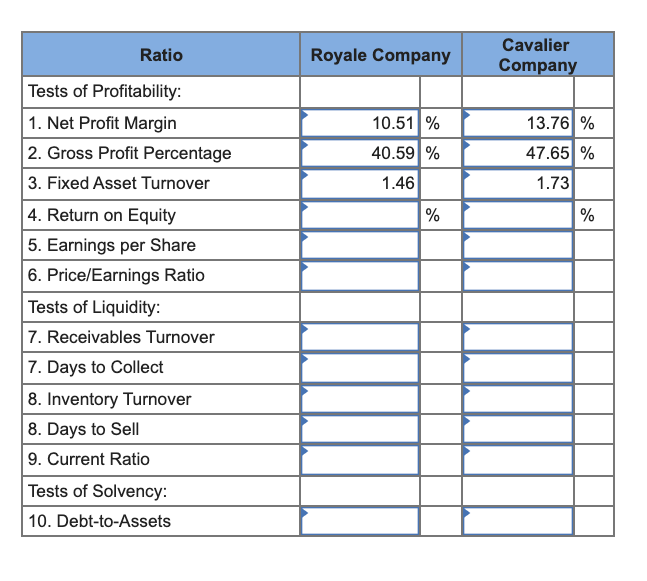
Transcribed Image Text:Cavalier
Ratio
Royale Company
Company
Tests of Profitability:
1. Net Profit Margin
10.51 %
13.76 %
2. Gross Profit Percentage
40.59 %
47.65 %
3. Fixed Asset Turnover
1.46
1.73
4. Return on Equity
%
%
5. Earnings per Share
6. Price/Earnings Ratio
Tests of Liquidity:
7. Receivables Turnover
7. Days to Collect
8. Inventory Turnover
8. Days to Sell
9. Current Ratio
Tests of Solvency:
10. Debt-to-Assets
Expert Solution
This question has been solved!
Explore an expertly crafted, step-by-step solution for a thorough understanding of key concepts.

This is a popular solution!

Trending now
This is a popular solution!

Step by step
Solved in 2 steps

Knowledge Booster


Learn more about
Need a deep-dive on the concept behind this application? Look no further. Learn more about this topic, accounting and related others by exploring similar questions and additional content below.Recommended textbooks for you
Managerial Accounting
Accounting
ISBN:
9781337912020
Author:
Carl Warren, Ph.d. Cma William B. Tayler
Publisher:
South-Western College Pub

Survey of Accounting (Accounting I)
Accounting
ISBN:
9781305961883
Author:
Carl Warren
Publisher:
Cengage Learning

Managerial Accounting: The Cornerstone of Busines…
Accounting
ISBN:
9781337115773
Author:
Maryanne M. Mowen, Don R. Hansen, Dan L. Heitger
Publisher:
Cengage Learning
Managerial Accounting
Accounting
ISBN:
9781337912020
Author:
Carl Warren, Ph.d. Cma William B. Tayler
Publisher:
South-Western College Pub
Survey of Accounting (Accounting I)
Accounting
ISBN:
9781305961883
Author:
Carl Warren
Publisher:
Cengage Learning
Managerial Accounting: The Cornerstone of Busines…
Accounting
ISBN:
9781337115773
Author:
Maryanne M. Mowen, Don R. Hansen, Dan L. Heitger
Publisher:
Cengage Learning

Principles of Accounting Volume 1
Accounting
ISBN:
9781947172685
Author:
OpenStax
Publisher:
OpenStax College