The following data relate the sales figures of the bar in Mark Kaltenbach's small bed-and-breakfast inn in Portland, to the number of guests registered that week: Week Guests 16 Bar Sales $340 2 12 $275 3 18 $375 4 14 $315 a) The simple linear regression equation that relates bar sales to number of guests (not to time) is (round your responses to one decimal place): Bar Sales =D+O×guests b) If the forecast is 20 guests next week, the bar sales are expected to be $ (round your response to one decimal place).
The following data relate the sales figures of the bar in Mark Kaltenbach's small bed-and-breakfast inn in Portland, to the number of guests registered that week: Week Guests 16 Bar Sales $340 2 12 $275 3 18 $375 4 14 $315 a) The simple linear regression equation that relates bar sales to number of guests (not to time) is (round your responses to one decimal place): Bar Sales =D+O×guests b) If the forecast is 20 guests next week, the bar sales are expected to be $ (round your response to one decimal place).

Practical Management Science
6th Edition
ISBN:9781337406659
Author:WINSTON, Wayne L.
Publisher:WINSTON, Wayne L.
Chapter13: Regression And Forecasting Models
Section13.3: Simple Regression Models
Problem 8P: The management of a technology company is trying to determine the variable that best explains the...

Related questions
Question
Question attached
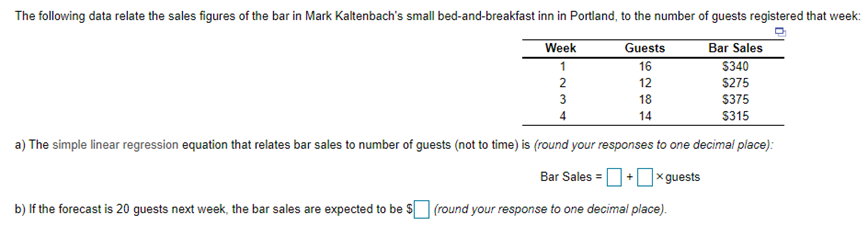
Transcribed Image Text:The following data relate the sales figures of the bar in Mark Kaltenbach's small bed-and-breakfast inn in Portland, to the number of guests registered that week:
Week
Bar Sales
$340
Guests
1
16
2
12
$275
3
18
$375
14
$315
a) The simple linear regression equation that relates bar sales to number of guests (not to time) is (round your responses to one decimal place):
Bar Sales =O+0xguests
b) If the forecast is 20 guests next week, the bar sales are expected to be SO (round your response to one decimal place).
Expert Solution
This question has been solved!
Explore an expertly crafted, step-by-step solution for a thorough understanding of key concepts.

This is a popular solution!

Trending now
This is a popular solution!

Step by step
Solved in 3 steps with 2 images

Recommended textbooks for you
Practical Management Science
Operations Management
ISBN:
9781337406659
Author:
WINSTON, Wayne L.
Publisher:
Cengage,
Practical Management Science
Operations Management
ISBN:
9781337406659
Author:
WINSTON, Wayne L.
Publisher:
Cengage,