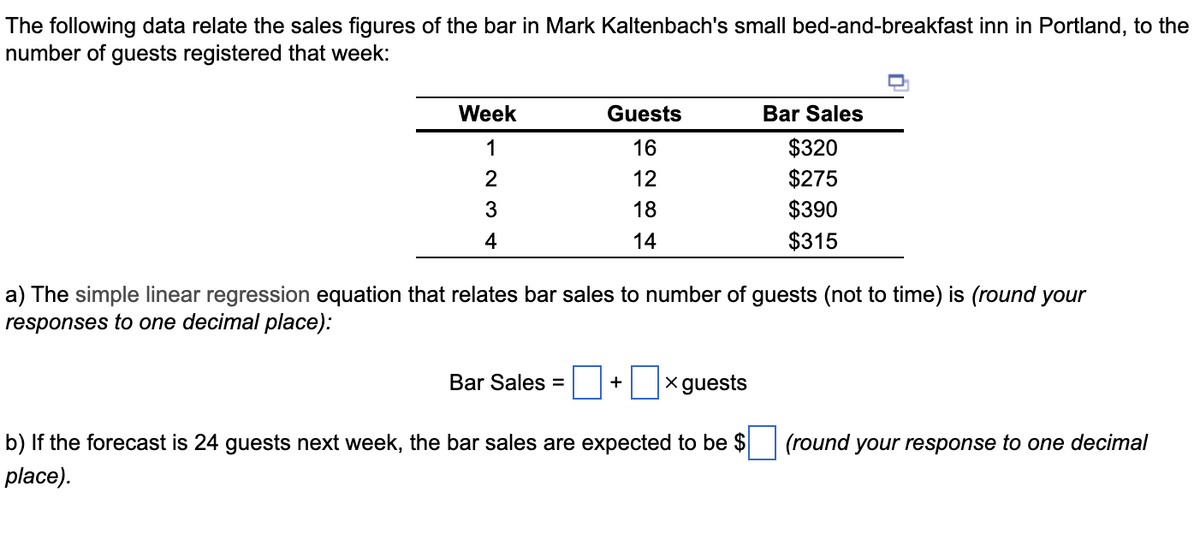
The following data relate the sales figures of the bar in Mark Kaltenbach's small bed-and-breakfast inn in Portland, to th number of guests registered that week: Week 1 2 3 4 Guests 16 12 18 14 Bar Sales = a) The simple linear regression equation that relates bar sales to number of guests (not to time) is (round your responses to one decimal place): + ☐ x guests Bar Sales $320 $275 $390 $315 b) If the forecast is 24 guests next week, the bar sales are expected to be $ place). (round your response to one decimal


Q: Explain why once revenue and total logistics costs are considered together, the optimal number of…
A: The total logistics cost is a measure of the total cost incurred in order to transport a product…
Q: As a part of its procurement strategy, a company is evaluating whether it should switch to a new…
A: Inventory management is described as the means through which a business or an enterprise maintains…
Q: 9.15 If the annual cost of goods sold is $30,000,000 and the average inventory is $5,000,000: a.…
A: Given data: Annual cost of goods sold = $30,000,000 Average inventory = $5,000,000
Q: 1. Select four small or large businesses and come up with unique distribution systems for them. 2.…
A: 1. A unique distribution channel can help a company stand out from the competition and gain a…
Q: Demand Medium $40 $45 Decision Manufacture component Purchase component a. Determine the best…
A: The expected value of perfect info.= expected value with perfect info.- expected value without…
Q: advantages of doing risk assessments for security
A: Security risk assessment outlines the probability of various probable risks which may occur so that…
Q: The ability to automatically detect the occurrence of an abnormality, thereby helping achieve…
A: Lean manufacturing is a strategy that highlights restricting waste inside manufacturing frameworks…
Q: Order-up to model is that have been ordered but have not been received. Order up to level is when…
A: This model is also called as Base stock model where an order, for maintaining inventory, is placed…
Q: To keep up with the volume of information transmitted between origin and destination points, use the…
A: Linear programming is a mathematical technique that is also used in operations management…
Q: The restaurant uses 24 bottles of wine to operate and it has 3 bottles in hand. Calculate the…
A: Given: Usage (U) = 24 Inventory in hand (H) = 3 Delivery days (D) = 2 Safety factor (S) = 10%
Q: 1 Explain the role and applications of management decision science in the inventoy management
A: Management science can be broadly defined as the study of problem solving and decision making in the…
Q: A manufacturer of engine parts produces valves and pistons at its main plant. Both parts are…
A:
Q: Question Completion Status: Tucson Macninary, Inc. manufacturers numerically controlled macnines…
A: Given data is
Q: Which of the following is a process consideration in the implementation of a lean system?…
A: A company or business unit is said to have a lean system if it applies lean concepts to all aspects…
Q: Each coffee table produced by Kevin Watson Designers nets the firm a profit of $10. Each bookcase…
A: Assume Decision variables: Let X1 = No of coffee tables to be produced per week and X2 = No of books…
Q: A renovation of the gift shop at Orlando Amway Center has six activities (in hours). In the…
A: The given data as follows: Activity a m b A 10 15 19 B 28 31 40 C 18 18 18 D 9 13 18 E…
Q: explain the project management and planning software importance in the control and prevention of…
A: Project management helps in managing every project in the company. it is like a single system that…
Q: (a)How many hours should Mary work in each place per week? State verbally the objective,…
A: Linear programming is a mathematical technique that is also used in operations management…
Q: explain the role of upstream strategic logistics (supply logistics) towards the success of the…
A: Upstream strategic logistics is the process of managing the distribution of goods from the point of…
Q: Can you please solve the linear equation graphically with clear steps
A: Linear programming is a mathematical technique that is also used in operations management…
Q: Use the Big M method, work through the simplex method step by step to solve the following problem.…
A: The Big M technique is a modified version of the simplex approach used in linear programming (LP),…
Q: Solve the problem using LP Model whether excel or graphical solution
A: Given data is
Q: Advantages & Disavantages of the following Project Delivery Methods: 1. Traditional…
A: DBB is perhaps still the most prevalent delivery methodology utilized today, & probably the…
Q: Briefly explain the goal of the project then discuss the importance of the following in a Project…
A: A project is defined as any endeavour undertaken to create a unique product, service or result. A…
Q: AMETEK has cost of goods sold of $2,102 million and annual turns of 4.901. Their holding cost is…
A: Average inventory = COGS/inventory turnover Total holding cost = average inventory*holding cost %
Q: A back office service structure is most similar to Part 2 A. a line process. B. a small batch…
A: Low diversity and high volume items are produced via line procedures. Manufacturers of automobiles…
Q: A craftsman named William Barnes builds two kinds of birdhouses, one for wrens and a second for…
A: Graphical Method: In order to find the optimal answer to a mathematical model, a procedure known as…
Q: What distinguishes risk management from risk assessment?
A: Risk is the likelihood that the result will be different from what is anticipated. Business risk is…
Q: Which statement is true? A. In the Service (Productt) Processs matrix, the degree of labor…
A: Service process matrix can be defined as a classification matrix of the service industry firms based…
Q: A plant is being built to manufacture two product families A and B. The facility must produce…
A: A. DA=DB=100,000/yearC1= $125,000C2= $65,000C3= $180,000 Let xij= the number of units of technology…
Q: A small software development project at Krishna Dhir's firm has five major activities. The times are…
A: Formulae used: To determine the expected time for each activity using the formula Expected time(E)…
Q: a. Plot the data. Does there seem to be a trend? b. Deseasonalize car sales. c. Plot the…
A: NOTE: We are allowed to do first three sub-parts only. Deseasonalized sales forecast is a method of…
Q: Take into account the traits that you believe make a project stand out.
A: Projects of a business are of core importance to its people working internally and associated…
Q: A manufacturer of office furniture has recently received a number of inquiries about its interest in…
A:
Q: Assuming the selling profits for products A, B and C are 2, 3 and 4€ per unit. Determine how many…
A: Linear programming is a mathematical technique that is also used in operations management…
Q: (a) Which of the constraints is redundant? Constraint #______. Justify by drawing a graph similar to…
A: Linear programming is a mathematical technique that is also used in operations management…
Q: Why use a project management software such as MS Project better than MS Excel to manage and store…
A: Project's built-in capabilities are superior to Excel when it comes to managing project information.…
Q: An Soda company sells about 400 gallons of its highly demanded beverage each week. The estimated…
A: EOQ = 2DSHHolding cost = Q*H2Setup cost = D*SQTotal cost = holding cost + setup costReorder level =…
Q: Raw materials can create a sourcing issue for businesses. How can a business reduce this potential…
A: Material is an important resource for any organization that is into manufacturing products for their…
Q: a. Determine the capacity of this process. b. Which action would yield the greatest increase…
A: Production is the process in which inputs are combined to have the required output. It includes a…
Q: Identify the several kinds of real-time scheduling techniques that are accessible to the project…
A: A project team of an organization is a different type of team compared to a regular business team.…
Q: Jse the Big M method, work through the simplex method step by step to demonstrate that the problem…
A: Linear programming is a mathematical technique that is also used in operations management…
Q: Discuss the main factors likely to be considered by a project manager when considering time– cost…
A: Time, cost, and quality are three important factors for any project and so it is necessary to…
Q: Frandec Company manufactures, assembles, and rebuilds material-handling equipment used in warehouses…
A:
Q: Suppose the LCL for a control chart is 2, the UCL is 10, and the CL is 6. Which of the following…
A: Given LCL = 2 UCL = 10
Q: After reading the stem et provided: Create a flowchart of the passenger arriving at an airport for…
A: Steps involved Passengers without masks get an exit Passengers with masks check in to obtain…
Q: John and Mary work for a direct marketing firm. They make calls to customers for a local carpet…
A: The productivity of an employee within the context of operations management highlights the amount of…
Q: Given a model of a simple queue, describe, in a simplified way, what is a source of customers.
A: Queueing model is used to explain the waiting line and help the decision maker to plan the capacity.…
Q: sia Furnishing is a retailer of modular toilet products. Currently, the lead time for one of the…
A:
Q: a) The expected (estimated) time for activity C is b) The variance for activity C is c) Based on the…
A: As per Bartleby guidelines, we can only solve the first three subparts of one question at a…


Trending now
This is a popular solution!

Step by step
Solved in 3 steps with 2 images

- A small computer chip manufacturer wants to forecast monthly ozperating costs as a function of the number of units produced during a month. The company has collected the 16 months of data in the file P13_34.xlsx. a. Determine an equation that can be used to predict monthly production costs from units produced. Are there any outliers? b. How could the regression line obtained in part a be used to determine whether the company was efficient or inefficient during any particular month?The management of a technology company is trying to determine the variable that best explains the variation of employee salaries using a sample of 52 full-time employees; see the file P13_08.xlsx. Estimate simple linear regression equations to identify which of the following has the strongest linear relationship with annual salary: the employees gender, age, number of years of relevant work experience prior to employment at the company, number of years of employment at the company, or number of years of post secondary education. Provide support for your conclusion.Stock market analysts are continually looking for reliable predictors of stock prices. Consider the problem of modeling the price per share of electric utility stocks (Y). Two variables thought to influence this stock price are return on average equity (X1) and annual dividend rate (X2). The stock price, returns on equity, and dividend rates on a randomly selected day for 16 electric utility stocks are provided in the file P13_15.xlsx. Estimate a multiple regression equation using the given data. Interpret each of the estimated regression coefficients. Also, interpret the standard error of estimate and the R-square value for these data.
- The owner of a restaurant in Bloomington, Indiana, has recorded sales data for the past 19 years. He has also recorded data on potentially relevant variables. The data are listed in the file P13_17.xlsx. a. Estimate a simple regression equation involving annual sales (the dependent variable) and the size of the population residing within 10 miles of the restaurant (the explanatory variable). Interpret R-square for this regression. b. Add another explanatory variableannual advertising expendituresto the regression equation in part a. Estimate and interpret this expanded equation. How does the R-square value for this multiple regression equation compare to that of the simple regression equation estimated in part a? Explain any difference between the two R-square values. How can you use the adjusted R-squares for a comparison of the two equations? c. Add one more explanatory variable to the multiple regression equation estimated in part b. In particular, estimate and interpret the coefficients of a multiple regression equation that includes the previous years advertising expenditure. How does the inclusion of this third explanatory variable affect the R-square, compared to the corresponding values for the equation of part b? Explain any changes in this value. What does the adjusted R-square for the new equation tell you?The Baker Company wants to develop a budget to predict how overhead costs vary with activity levels. Management is trying to decide whether direct labor hours (DLH) or units produced is the better measure of activity for the firm. Monthly data for the preceding 24 months appear in the file P13_40.xlsx. Use regression analysis to determine which measure, DLH or Units (or both), should be used for the budget. How would the regression equation be used to obtain the budget for the firms overhead costs?A trucking company wants to predict the yearly maintenance expense (Y) for a truck using the number of miles driven during the year (X1) and the age of the truck (X2, in years) at the beginning of the year. The company has gathered the data given in the file P13_13.xlsx. Note that each observation corresponds to a particular truck. Estimate a multiple regression equation using the given data. Interpret each of the estimated regression coefficients. Also, interpret the standard error of estimate and the R-square value for these data.
- An antique collector believes that the price received for a particular item increases with its age and with the number of bidders. The file P13_14.xlsx contains data on these three variables for 32 recently auctioned comparable items. Estimate a multiple regression equation using the given data. Interpret each of the estimated regression coefficients. Is the antique collector correct in believing that the price received for the item increases with its age and with the number of bidders? Interpret the standard error of estimate and the R-square value for these data.Do the sales prices of houses in a given community vary systematically with their sizes (as measured in square feet)? Answer this question by estimating a simple regression equation where the sales price of the house is the dependent variable, and the size of the house is the explanatory variable. Use the sample data given in P13_06.xlsx. Interpret your estimated equation, the associated R-square value, and the associated standard error of estimate.Management of a home appliance store would like to understand the growth pattern of the monthly sales of Blu-ray disc players over the past two years. Managers have recorded the relevant data in the file P13_33.xlsx. a. Create a scatterplot for these data. Comment on the observed behavior of monthly sales at this store over time. b. Estimate an appropriate regression equation to explain the variation of monthly sales over the given time period. Interpret the estimated regression coefficients. c. Analyze the estimated equations residuals. Do they suggest that the regression equation is adequate? If not, return to part b and revise your equation. Continue to revise the equation until the results are satisfactory.
- The file P13_28.xlsx contains monthly retail sales of U.S. liquor stores. a. Is seasonality present in these data? If so, characterize the seasonality pattern. b. Use Winters method to forecast this series with smoothing constants = = 0.1 and = 0.3. Does the forecast series seem to track the seasonal pattern well? What are your forecasts for the next 12 months?The file P13_29.xlsx contains monthly time series data for total U.S. retail sales of building materials (which includes retail sales of building materials, hardware and garden supply stores, and mobile home dealers). a. Is seasonality present in these data? If so, characterize the seasonality pattern. b. Use Winters method to forecast this series with smoothing constants = = 0.1 and = 0.3. Does the forecast series seem to track the seasonal pattern well? What are your forecasts for the next 12 months?The file P13_26.xlsx contains the monthly number of airline tickets sold by the CareFree Travel Agency. a. Create a time series chart of the data. Based on what you see, which of the exponential smoothing models do you think will provide the best forecasting model? Why? b. Use simple exponential smoothing to forecast these data, using a smoothing constant of 0.1. c. Repeat part b, but search for the smoothing constant that makes RMSE as small as possible. Does it make much of an improvement over the model in part b?