The following data represent the concentration of organic carbon (mg/L) collected from organic soil. Construct a 99% confidence interval for the mean concentration of dissolved organic carbon collected from organic soil. (Note: x = 17.8 mg/L and s = 7.69 mg/L) 22.49 8.81 29.80 27.10 16.51 17.50 33.67 14.00 20.46 14.90 30.91 14.86 11.40 15.35 9.72 19.80 14.86 8.09 7.40 18.30 Citck here to view page 1 of the table of crilical vaues for the t distribution Click here to view page 2 of the table of critical values for the t distribution. Construct a 99% confidence interval for the mean concentration of dissolved organic carbon collected from organic soil. O mg/L to mg/L (Use ascending order. Round to two decimal places as needed.)
The following data represent the concentration of organic carbon (mg/L) collected from organic soil. Construct a 99% confidence interval for the mean concentration of dissolved organic carbon collected from organic soil. (Note: x = 17.8 mg/L and s = 7.69 mg/L) 22.49 8.81 29.80 27.10 16.51 17.50 33.67 14.00 20.46 14.90 30.91 14.86 11.40 15.35 9.72 19.80 14.86 8.09 7.40 18.30 Citck here to view page 1 of the table of crilical vaues for the t distribution Click here to view page 2 of the table of critical values for the t distribution. Construct a 99% confidence interval for the mean concentration of dissolved organic carbon collected from organic soil. O mg/L to mg/L (Use ascending order. Round to two decimal places as needed.)

Glencoe Algebra 1, Student Edition, 9780079039897, 0079039898, 2018
18th Edition
ISBN:9780079039897
Author:Carter
Publisher:Carter
Chapter10: Statistics
Section10.4: Distributions Of Data
Problem 19PFA

Related questions
Question
Solve it correctly please. I will rate accordingly. I will rate with 4votes but need correct answer.
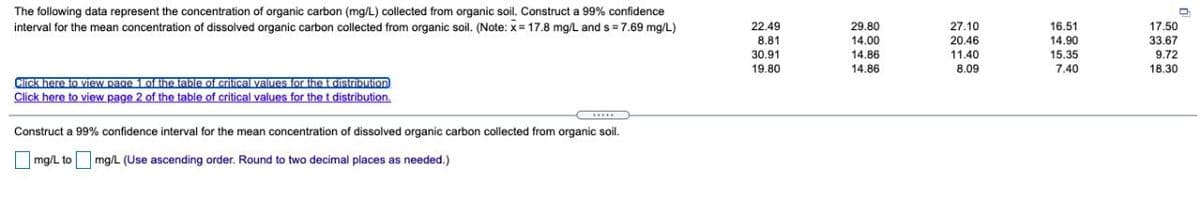
Transcribed Image Text:The following data represent the concentration of organic carbon (mg/L) collected from organic soil. Construct a 99% confidence
interval for the mean concentration of dissolved organic carbon collected from organic soil. (Note: x= 17.8 mg/L and s = 7.69 mg/L)
22.49
29.80
14.00
14,86
14.86
27.10
20.46
11.40
8.09
16.51
14.90
15,35
17.50
8.81
33.67
30.91
19.80
9.72
7.40
18.30
Click here to view page 1 oihe table of criical values for the t distriDution
Click here to view page 2 of the table of critical values for the t distribution.
Construct a 99% confidence interval for the mean concentration of dissolved organic carbon collected from organic soil.
|mg/L to mg/L (Use ascending order. Round to two decimal places as needed.)
Expert Solution
This question has been solved!
Explore an expertly crafted, step-by-step solution for a thorough understanding of key concepts.

Step by step
Solved in 2 steps with 1 images

Recommended textbooks for you
Glencoe Algebra 1, Student Edition, 9780079039897…
Algebra
ISBN:
9780079039897
Author:
Carter
Publisher:
McGraw Hill
Glencoe Algebra 1, Student Edition, 9780079039897…
Algebra
ISBN:
9780079039897
Author:
Carter
Publisher:
McGraw Hill