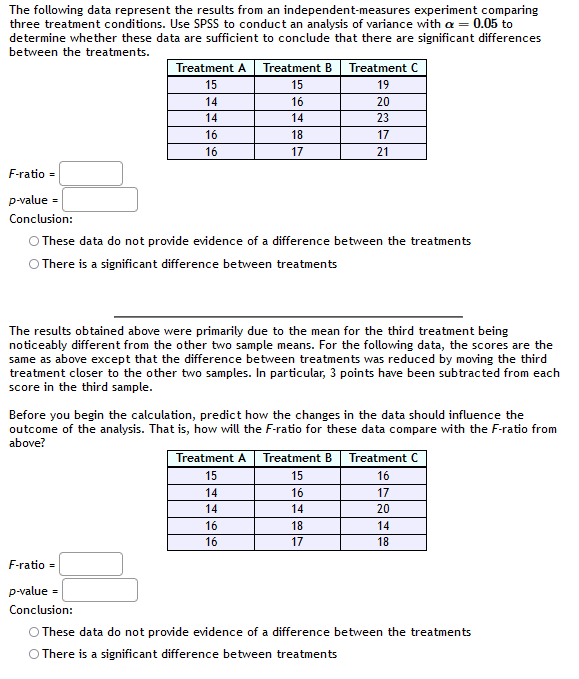
The following data represent the results from an independent-measures experiment comparing three treatment conditions. Use SPSS to conduct an analysis of variance with a = 0.05 to determine whether these data are sufficient to conclude that there are significant differences between the treatments. Treatment A Treatment B Treatment C 15 15 19 14 16 20 14 14 23 16 18 17 16 17 21 F-ratio = p-value = Conclusion: O These data do not provide evidence of a difference between the treatments O There is a significant difference between treatments The results obtained above were primarily due to the mean for the third treatment being noticeably different from the other two sample means. For the following data, the scores are the same as above except that the difference between treatments was reduced by moving the third treatment closer to the other two samples. In particular, 3 points have been subtracted from each score in the third sample. Before you begin the calculation, predict how the changes in the data should influence the outcome of the analysis. That is, how will the F-ratio for these data compare with the F-ratio from above? Treatment A Treatment B Treatment C 15 15 16 14 16 17 14 14 20 16 18 14 16 17 18 F-ratio = p-value = Conclusion: O These data do not provide evidence of a difference between the treatments O There is a significant difference between treatments
The following data represent the results from an independent-measures experiment comparing three treatment conditions. Use SPSS to conduct an analysis of variance with a = 0.05 to determine whether these data are sufficient to conclude that there are significant differences between the treatments. Treatment A Treatment B Treatment C 15 15 19 14 16 20 14 14 23 16 18 17 16 17 21 F-ratio = p-value = Conclusion: O These data do not provide evidence of a difference between the treatments O There is a significant difference between treatments The results obtained above were primarily due to the mean for the third treatment being noticeably different from the other two sample means. For the following data, the scores are the same as above except that the difference between treatments was reduced by moving the third treatment closer to the other two samples. In particular, 3 points have been subtracted from each score in the third sample. Before you begin the calculation, predict how the changes in the data should influence the outcome of the analysis. That is, how will the F-ratio for these data compare with the F-ratio from above? Treatment A Treatment B Treatment C 15 15 16 14 16 17 14 14 20 16 18 14 16 17 18 F-ratio = p-value = Conclusion: O These data do not provide evidence of a difference between the treatments O There is a significant difference between treatments

Glencoe Algebra 1, Student Edition, 9780079039897, 0079039898, 2018
18th Edition
ISBN:9780079039897
Author:Carter
Publisher:Carter
Chapter10: Statistics
Section10.4: Distributions Of Data
Problem 19PFA

Related questions
Question
Transcribed Image Text:The following data represent the results from an independent-measures experiment comparing
three treatment conditions. Use SPSS to conduct an analysis of variance with a = 0.05 to
determine whether these data are sufficient to conclude that there are significant differences
between the treatments.
Treatment A
Treatment B
Treatment C
15
15
19
14
16
20
14
14
23
16
18
17
16
17
21
F-ratio =
p-value =
Conclusion:
O These data do not provide evidence of a difference between the treatments
O There is a significant difference between treatments
The results obtained above were primarily due to the mean for the third treatment being
noticeably different from the other two sample means. For the following data, the scores are the
same as above except that the difference between treatments was reduced by moving the third
treatment closer to the other two samples. In particular, 3 points have been subtracted from each
score in the third sample.
Before you begin the calculation, predict how the changes in the data should influence the
outcome of the analysis. That is, how will the F-ratio for these data compare with the F-ratio from
above?
Treatment A
Treatment B
Treatment C
15
15
16
14
16
17
14
14
20
16
18
14
16
17
18
F-ratio =
p-value =
Conclusion:
O These data do not provide evidence of a difference between the treatments
O There is a significant difference between treatments
Expert Solution
This question has been solved!
Explore an expertly crafted, step-by-step solution for a thorough understanding of key concepts.

This is a popular solution!

Trending now
This is a popular solution!

Step by step
Solved in 3 steps with 5 images

Knowledge Booster


Learn more about
Need a deep-dive on the concept behind this application? Look no further. Learn more about this topic, probability and related others by exploring similar questions and additional content below.Recommended textbooks for you
Glencoe Algebra 1, Student Edition, 9780079039897…
Algebra
ISBN:
9780079039897
Author:
Carter
Publisher:
McGraw Hill
Glencoe Algebra 1, Student Edition, 9780079039897…
Algebra
ISBN:
9780079039897
Author:
Carter
Publisher:
McGraw Hill