the following equations represents the graph shown?

Algebra & Trigonometry with Analytic Geometry
13th Edition
ISBN:9781133382119
Author:Swokowski
Publisher:Swokowski
Chapter7: Analytic Trigonometry
Section7.5: Product-to-sum And Sum-to-product Formulas
Problem 38E

Related questions
Question
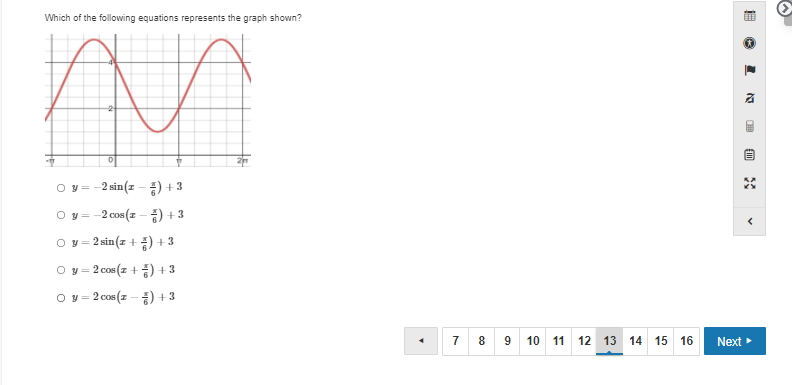
Transcribed Image Text:Which of the following equations represents the graph shown?
O y = -2 sin(z – ) + 3
O y = -2 cos (z - ) + 3
O v = 2 sin (z + ) + 3
O y = 2 cos (z +) + 3
O v = 2 cos (z – ) + 3
7
8.
10 11
12 13 14 15
16
Next
Expert Solution
This question has been solved!
Explore an expertly crafted, step-by-step solution for a thorough understanding of key concepts.

This is a popular solution!

Trending now
This is a popular solution!

Step by step
Solved in 2 steps with 2 images

Knowledge Booster


Learn more about
Need a deep-dive on the concept behind this application? Look no further. Learn more about this topic, trigonometry and related others by exploring similar questions and additional content below.Recommended textbooks for you
Algebra & Trigonometry with Analytic Geometry
Algebra
ISBN:
9781133382119
Author:
Swokowski
Publisher:
Cengage
Algebra & Trigonometry with Analytic Geometry
Algebra
ISBN:
9781133382119
Author:
Swokowski
Publisher:
Cengage