The following graph shows a rough approximation of historical and projected median home prices for a country for the period 2000-2024. C(1) 210, 180 150 120 90 60 30 0 9 12 15 19 21 24 i Here, t is time in years since the start of 2000, and C(t) is the median home price in thousands of dollars. The locations of stationary points and points of inflection are indicated on the graph. Analyze the graph's important features, and interpret each feature in terms of the median home price. The median home price was $ thousand at the start of 2000 (t = 0). 0 3 6 The median home price has two low points; first in the year peaked at the start of the year at $ and again in the year thousand. when it was $ when it stood at $ The median home price was decreasing most rapidly at the start of the year thousand. when it was $ Assuming that the trend shown in the graph continued indefinitely, the median home price would approach a value of $ thousand; the median home pri thousand, and increasing most rapidly at the start of the y thousand in the long term.
The following graph shows a rough approximation of historical and projected median home prices for a country for the period 2000-2024. C(1) 210, 180 150 120 90 60 30 0 9 12 15 19 21 24 i Here, t is time in years since the start of 2000, and C(t) is the median home price in thousands of dollars. The locations of stationary points and points of inflection are indicated on the graph. Analyze the graph's important features, and interpret each feature in terms of the median home price. The median home price was $ thousand at the start of 2000 (t = 0). 0 3 6 The median home price has two low points; first in the year peaked at the start of the year at $ and again in the year thousand. when it was $ when it stood at $ The median home price was decreasing most rapidly at the start of the year thousand. when it was $ Assuming that the trend shown in the graph continued indefinitely, the median home price would approach a value of $ thousand; the median home pri thousand, and increasing most rapidly at the start of the y thousand in the long term.

Trigonometry (MindTap Course List)
10th Edition
ISBN:9781337278461
Author:Ron Larson
Publisher:Ron Larson
Chapter5: Exponential And Logarithmic Functions
Section5.5: Exponential And Logarithmic Models
Problem 4ECP

Related questions
Question
Help please
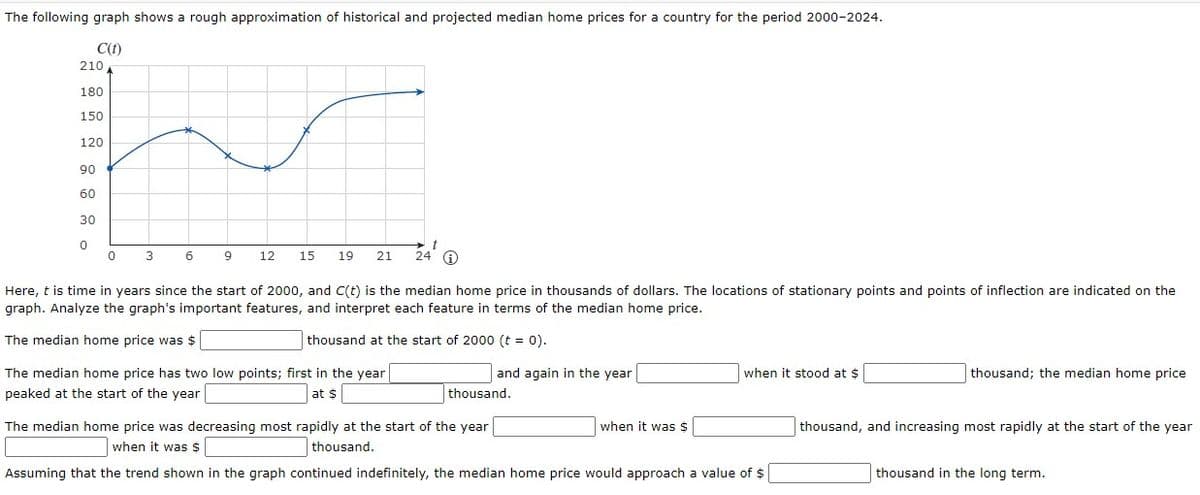
Transcribed Image Text:The following graph shows a rough approximation of historical and projected median home prices for a country for the period 2000-2024.
C(t)
210
180
150
120
90
60
30
0
0
3
6
9
t
12 15 19 21 24 Ⓡ
Here, t is time in years since the start of 2000, and C(t) is the median home price in thousands of dollars. The locations of stationary points and points of inflection are indicated on the
graph. Analyze the graph's important features, and interpret each feature in terms of the median home price.
The median home price was $
thousand at the start of 2000 (t = 0).
The median home price has two low points; first in the year
peaked at the start of the year
at $
and again in the year
thousand.
when it stood at $
The median home price was decreasing most rapidly at the start of the year
thousand.
when it was $
Assuming that the trend shown in the graph continued indefinitely, the median home price would approach a value of $
when it was $
thousand; the median home price
thousand, and increasing most rapidly at the start of the year
thousand in the long term.
Expert Solution
This question has been solved!
Explore an expertly crafted, step-by-step solution for a thorough understanding of key concepts.

This is a popular solution!

Trending now
This is a popular solution!

Step by step
Solved in 2 steps with 2 images

Recommended textbooks for you
Trigonometry (MindTap Course List)
Trigonometry
ISBN:
9781337278461
Author:
Ron Larson
Publisher:
Cengage Learning


Functions and Change: A Modeling Approach to Coll…
Algebra
ISBN:
9781337111348
Author:
Bruce Crauder, Benny Evans, Alan Noell
Publisher:
Cengage Learning
Trigonometry (MindTap Course List)
Trigonometry
ISBN:
9781337278461
Author:
Ron Larson
Publisher:
Cengage Learning
Functions and Change: A Modeling Approach to Coll…
Algebra
ISBN:
9781337111348
Author:
Bruce Crauder, Benny Evans, Alan Noell
Publisher:
Cengage Learning

Algebra and Trigonometry (MindTap Course List)
Algebra
ISBN:
9781305071742
Author:
James Stewart, Lothar Redlin, Saleem Watson
Publisher:
Cengage Learning

Algebra & Trigonometry with Analytic Geometry
Algebra
ISBN:
9781133382119
Author:
Swokowski
Publisher:
Cengage