The following graph shows the average American household debt h as a function of the date d. 140 Household debt 888888 120 100 20 47% 0 1955 1965 1975 1985 1995 2005 Here h(d) represents household debt as a percentage of disposable income. (a) Explain the meaning of h(1975) in practical terms. Oh(1975) represents the year in which household debt was at its minimum value. Oh(1975) is the average American household debt in dollars in 1975. Oh(1975) is the average American household debt, as a decimal, in 1975. Oh(1975) represents the year in which household debt was at its maximum value. Oh(1975) is the average American household debt as a percentage of disposable income in 1975. Use the graph to find its value. % (b) The graph reaches a maximum value. Estimate the maximum value. % Estimate the year in which the maximum value occurred.
The following graph shows the average American household debt h as a function of the date d. 140 Household debt 888888 120 100 20 47% 0 1955 1965 1975 1985 1995 2005 Here h(d) represents household debt as a percentage of disposable income. (a) Explain the meaning of h(1975) in practical terms. Oh(1975) represents the year in which household debt was at its minimum value. Oh(1975) is the average American household debt in dollars in 1975. Oh(1975) is the average American household debt, as a decimal, in 1975. Oh(1975) represents the year in which household debt was at its maximum value. Oh(1975) is the average American household debt as a percentage of disposable income in 1975. Use the graph to find its value. % (b) The graph reaches a maximum value. Estimate the maximum value. % Estimate the year in which the maximum value occurred.

Functions and Change: A Modeling Approach to College Algebra (MindTap Course List)
6th Edition
ISBN:9781337111348
Author:Bruce Crauder, Benny Evans, Alan Noell
Publisher:Bruce Crauder, Benny Evans, Alan Noell
Chapter3: Straight Lines And Linear Functions
Section3.3: Modeling Data With Linear Functions
Problem 17E: Later High School Graduates This is a continuation of Exercise 16. The following table shows the...

Related questions
Question
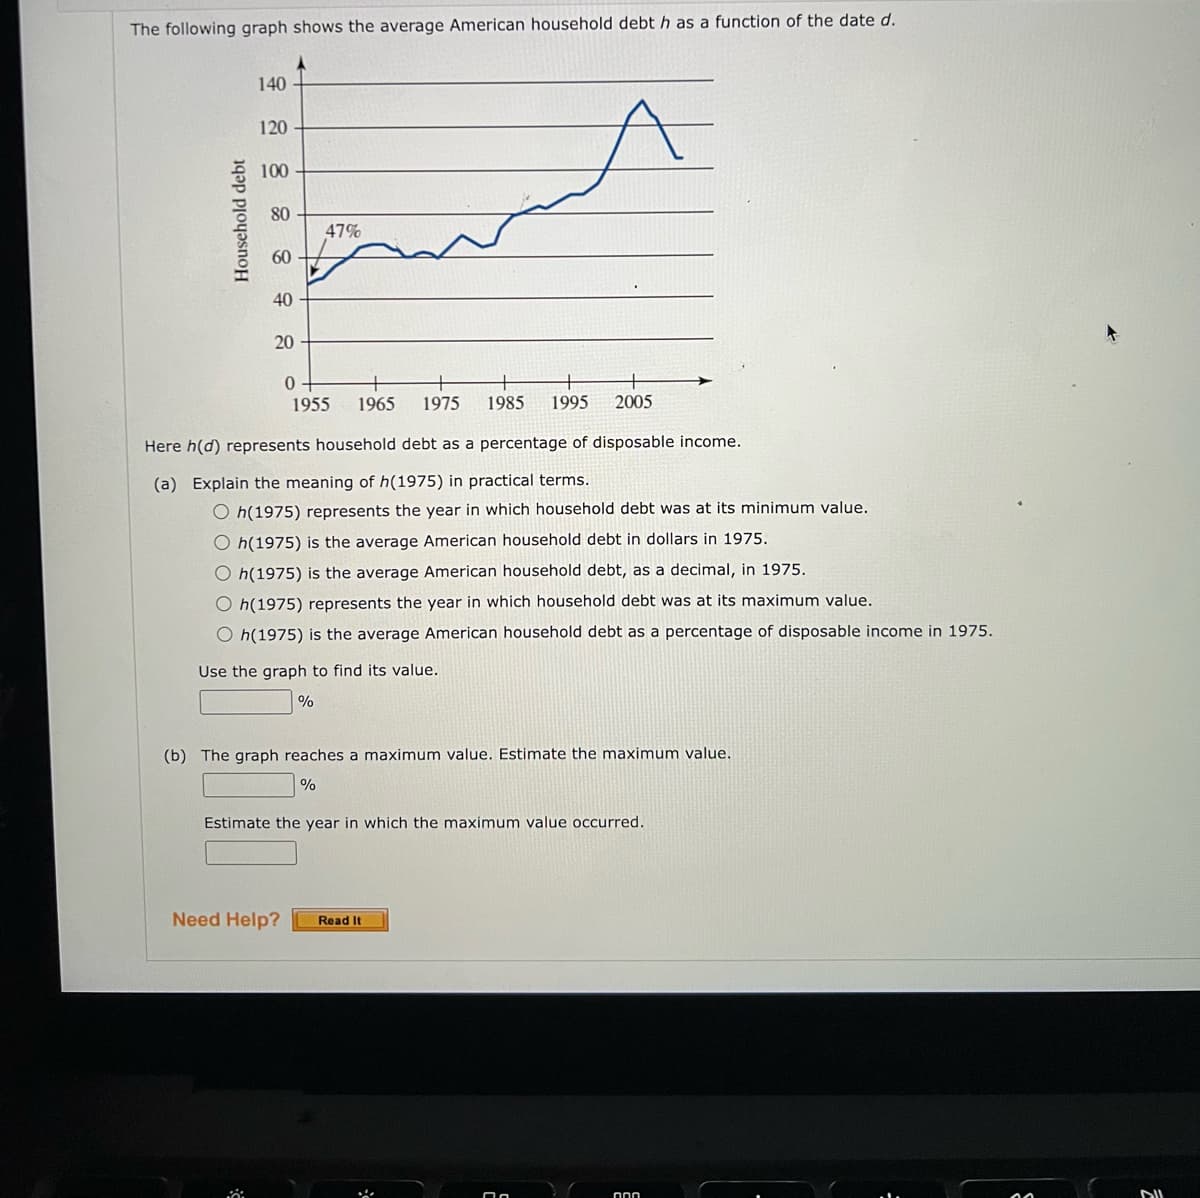
Transcribed Image Text:The following graph shows the average American household debt h as a function of the date d.
Household debt
140
120
100
80
60
40
20
47%
0
1955 1965 1975 1985 1995 2005
Here h(d) represents household debt as a percentage of disposable income.
(a) Explain the meaning of h(1975) in practical terms.
Oh(1975) represents the year in which household debt was at its minimum value.
Oh(1975) is the average American household debt in dollars in 1975.
Oh(1975) is the average American household debt, as a decimal, in 1975.
Oh(1975) represents the year in which household debt was at its maximum value.
Oh(1975) is the average American household debt as a percentage of disposable income in 1975.
Use the graph to find its value.
%
(b) The graph reaches a maximum value. Estimate the maximum value.
%
Estimate the year in which the maximum value occurred.
Need Help? Read It
000
DIL
Expert Solution
This question has been solved!
Explore an expertly crafted, step-by-step solution for a thorough understanding of key concepts.

Step by step
Solved in 2 steps with 2 images

Recommended textbooks for you
Functions and Change: A Modeling Approach to Coll…
Algebra
ISBN:
9781337111348
Author:
Bruce Crauder, Benny Evans, Alan Noell
Publisher:
Cengage Learning

Algebra & Trigonometry with Analytic Geometry
Algebra
ISBN:
9781133382119
Author:
Swokowski
Publisher:
Cengage

Algebra and Trigonometry (MindTap Course List)
Algebra
ISBN:
9781305071742
Author:
James Stewart, Lothar Redlin, Saleem Watson
Publisher:
Cengage Learning
Functions and Change: A Modeling Approach to Coll…
Algebra
ISBN:
9781337111348
Author:
Bruce Crauder, Benny Evans, Alan Noell
Publisher:
Cengage Learning
Algebra & Trigonometry with Analytic Geometry
Algebra
ISBN:
9781133382119
Author:
Swokowski
Publisher:
Cengage
Algebra and Trigonometry (MindTap Course List)
Algebra
ISBN:
9781305071742
Author:
James Stewart, Lothar Redlin, Saleem Watson
Publisher:
Cengage Learning
