The following graph shows the average American household debt h as a function of the date d. Household debt 140 120 100 80 60 40 20 47% 1955 1965 1975 1985 1995 2005 Here h(d) represents household debt as a percentage of disposable income. (a) Explain the meaning of h(1975) in practical terms
The following graph shows the average American household debt h as a function of the date d. Household debt 140 120 100 80 60 40 20 47% 1955 1965 1975 1985 1995 2005 Here h(d) represents household debt as a percentage of disposable income. (a) Explain the meaning of h(1975) in practical terms

Functions and Change: A Modeling Approach to College Algebra (MindTap Course List)
6th Edition
ISBN:9781337111348
Author:Bruce Crauder, Benny Evans, Alan Noell
Publisher:Bruce Crauder, Benny Evans, Alan Noell
Chapter3: Straight Lines And Linear Functions
Section3.3: Modeling Data With Linear Functions
Problem 17E: Later High School Graduates This is a continuation of Exercise 16. The following table shows the...

Related questions
Question
The following graph shows the average American household debt h as a function of the date d.
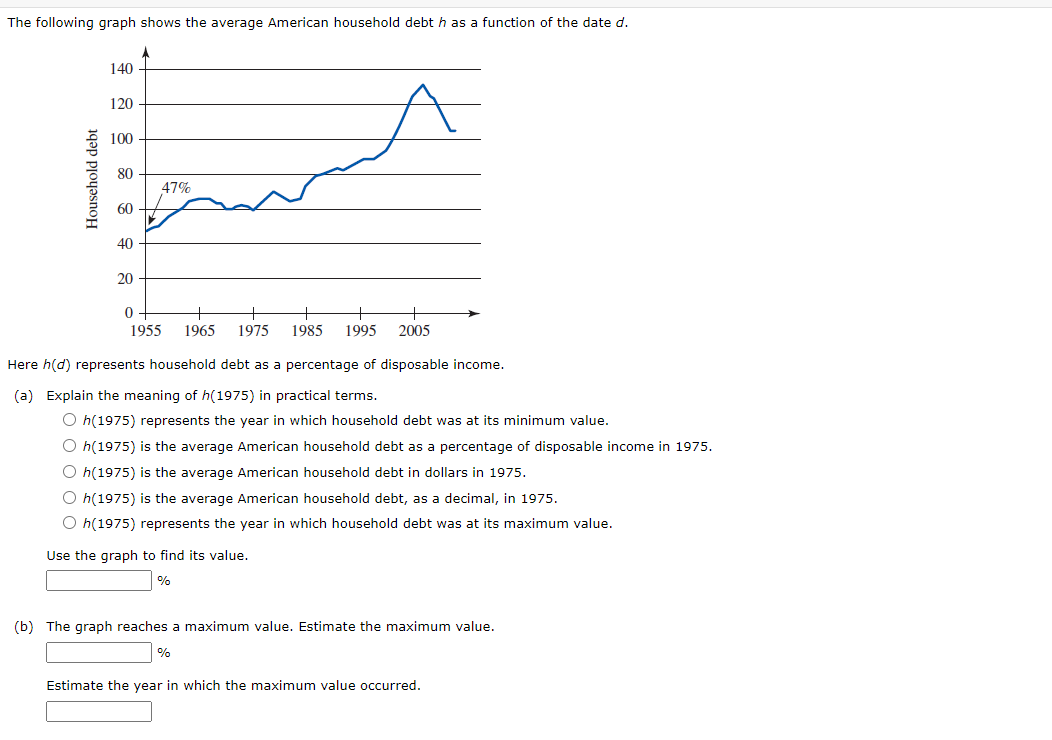
Transcribed Image Text:The following graph shows the average American household debt h as a function of the date d.
Household debt
140
120
100
80
60
40
20
47%
0
1955 1965 1975 1985 1995 2005
Here h(d) represents household debt as a percentage of disposable income.
(a) Explain the meaning of h(1975) in practical terms.
O h(1975) represents the year in which household debt was at its minimum value.
O h(1975) is the average American household debt as a percentage of disposable income in 1975.
O h(1975) is the average American household debt in dollars in 1975.
O h(1975) is the average American household debt, as a decimal, in 1975.
O h(1975) represents the year in which household debt was at its maximum value.
Use the graph to find its value.
%
(b) The graph reaches a maximum value. Estimate the maximum value.
%
Estimate the year in which the maximum value occurred.
Expert Solution
This question has been solved!
Explore an expertly crafted, step-by-step solution for a thorough understanding of key concepts.

Step by step
Solved in 2 steps with 1 images

Recommended textbooks for you
Functions and Change: A Modeling Approach to Coll…
Algebra
ISBN:
9781337111348
Author:
Bruce Crauder, Benny Evans, Alan Noell
Publisher:
Cengage Learning

Algebra & Trigonometry with Analytic Geometry
Algebra
ISBN:
9781133382119
Author:
Swokowski
Publisher:
Cengage

Algebra and Trigonometry (MindTap Course List)
Algebra
ISBN:
9781305071742
Author:
James Stewart, Lothar Redlin, Saleem Watson
Publisher:
Cengage Learning
Functions and Change: A Modeling Approach to Coll…
Algebra
ISBN:
9781337111348
Author:
Bruce Crauder, Benny Evans, Alan Noell
Publisher:
Cengage Learning
Algebra & Trigonometry with Analytic Geometry
Algebra
ISBN:
9781133382119
Author:
Swokowski
Publisher:
Cengage
Algebra and Trigonometry (MindTap Course List)
Algebra
ISBN:
9781305071742
Author:
James Stewart, Lothar Redlin, Saleem Watson
Publisher:
Cengage Learning
