The following graph shows the position functions of two runners, A and B, who run a 100-meter race and finish in a tie. s (meters)A 80 40 B. artl 0. 4 8. 12 t (seconds) (a) Describe and compare how the runners run the race. O Runner A starts the race at a slower velocity than runner B but finishes the race at a faster velocity. Runner B runs the entire race at the same velocity. O Runner A starts the race at a faster velocity than runner B but finishes the race at a slower velocity. Runner B runs the entire race at the same velocity. O Runner A runs the entire race at the same velocity. Runner B starts the race at a slower velocity than runner A but finishes the race at a faster velocity. O Runner A runs the entire race at the same velocity. Runner B starts the race at a faster velocity than runner A but finishes the race at a slower velocity. or O Runner A and runner B both start and end the race a the same velocities. (b) How long after the race began (in seconds) is the distance between the runners the greatest? (c) How long after the race began (in seconds) do the runners have the same velocity?
The following graph shows the position functions of two runners, A and B, who run a 100-meter race and finish in a tie. s (meters)A 80 40 B. artl 0. 4 8. 12 t (seconds) (a) Describe and compare how the runners run the race. O Runner A starts the race at a slower velocity than runner B but finishes the race at a faster velocity. Runner B runs the entire race at the same velocity. O Runner A starts the race at a faster velocity than runner B but finishes the race at a slower velocity. Runner B runs the entire race at the same velocity. O Runner A runs the entire race at the same velocity. Runner B starts the race at a slower velocity than runner A but finishes the race at a faster velocity. O Runner A runs the entire race at the same velocity. Runner B starts the race at a faster velocity than runner A but finishes the race at a slower velocity. or O Runner A and runner B both start and end the race a the same velocities. (b) How long after the race began (in seconds) is the distance between the runners the greatest? (c) How long after the race began (in seconds) do the runners have the same velocity?

College Algebra
7th Edition
ISBN:9781305115545
Author:James Stewart, Lothar Redlin, Saleem Watson
Publisher:James Stewart, Lothar Redlin, Saleem Watson
Chapter2: Functions
Section: Chapter Questions
Problem 7T

Related questions
Topic Video
Question
100%
Help me to find the answers
Transcribed Image Text:s (meters),
80
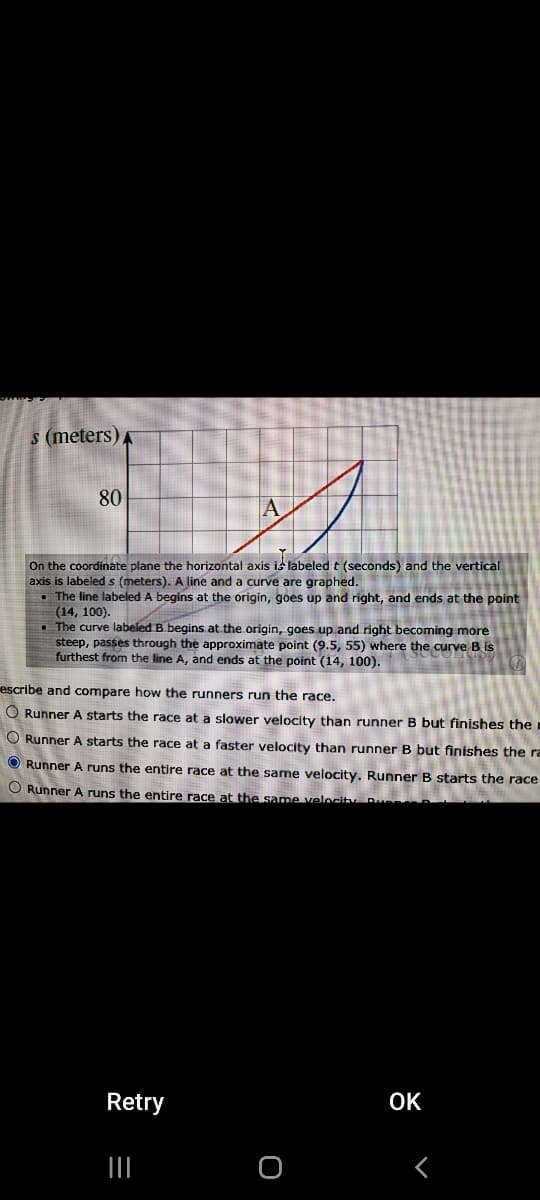
On the coordinate plane the horizontal axis is labeled t (seconds) and the vertical
axis is labeled s (meters). A line and a curve are graphed.
• The line labeled A begins at the origin, goes up and right, and ends at the point
(14, 100).
. The curve labeled B begins at the origin, goes up and right becoming more
steep, passes through the approximate point (9.5, 55) where the curve B is
furthest from the line A, and ends at the point (14, 100).
escribe and compare how the runners run the race.
O Runner A starts the race at a slower velocity than runner B but finishes the
O Runner A starts the race at a faster velocity than runner B but finishes the ra
O Runner A runs the entire race at the same velocity. Runner B starts the race
O Runner A runs the entire race at the same velocit
Retry
OK
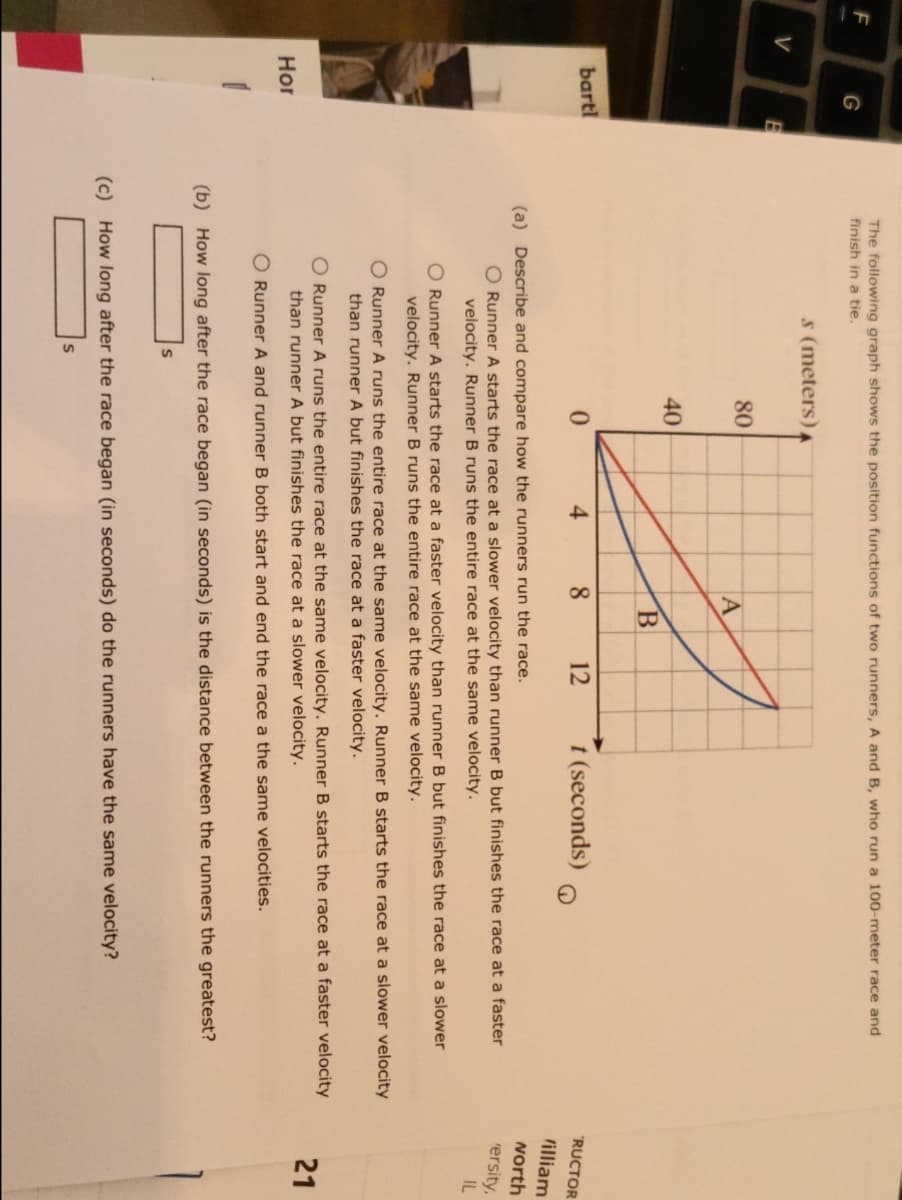
Transcribed Image Text:The following graph shows the position functions of two runners, A and B, who run a 100-meter race and
finish in a tie.
s (meters)A
V
80
40
B
bartl
8.
12
t (seconds)
0.
4.
"RUCTOR
rilliam
worth
(a) Describe and compare how the runners run the race.
O Runner A starts the race at a slower velocity than runner B but finishes the race at a faster
velocity. Runner B runs the entire race at the same velocity.
ersity,
IL
O Runner A starts the race at a faster velocity than runner B but finishes the race at a slower
velocity. Runner B runs the entire race at the same velocity.
O Runner A runs the entire race at the same velocity. Runner B starts the race at a slower velocity
than runner A but finishes the race at a faster velocity.
Runner A runs the entire race at the same velocity. Runner B starts the race at a faster velocity
21
than runner A but finishes the race at a slower velocity.
Hor
O Runner A and runner B both start and end the race a the same velocities.
(b) How long after the race began (in seconds) is the distance between the runners the greatest?
(c) How long after the race began (in seconds) do the runners have the same velocity?
Expert Solution
This question has been solved!
Explore an expertly crafted, step-by-step solution for a thorough understanding of key concepts.

This is a popular solution!

Trending now
This is a popular solution!

Step by step
Solved in 2 steps with 2 images

Knowledge Booster


Learn more about
Need a deep-dive on the concept behind this application? Look no further. Learn more about this topic, calculus and related others by exploring similar questions and additional content below.Recommended textbooks for you
College Algebra
Algebra
ISBN:
9781305115545
Author:
James Stewart, Lothar Redlin, Saleem Watson
Publisher:
Cengage Learning

Glencoe Algebra 1, Student Edition, 9780079039897…
Algebra
ISBN:
9780079039897
Author:
Carter
Publisher:
McGraw Hill

Algebra and Trigonometry (MindTap Course List)
Algebra
ISBN:
9781305071742
Author:
James Stewart, Lothar Redlin, Saleem Watson
Publisher:
Cengage Learning
College Algebra
Algebra
ISBN:
9781305115545
Author:
James Stewart, Lothar Redlin, Saleem Watson
Publisher:
Cengage Learning
Glencoe Algebra 1, Student Edition, 9780079039897…
Algebra
ISBN:
9780079039897
Author:
Carter
Publisher:
McGraw Hill
Algebra and Trigonometry (MindTap Course List)
Algebra
ISBN:
9781305071742
Author:
James Stewart, Lothar Redlin, Saleem Watson
Publisher:
Cengage Learning

Algebra & Trigonometry with Analytic Geometry
Algebra
ISBN:
9781133382119
Author:
Swokowski
Publisher:
Cengage


Trigonometry (MindTap Course List)
Trigonometry
ISBN:
9781337278461
Author:
Ron Larson
Publisher:
Cengage Learning