The following graph shows the recent HIV status of expecting South African women. Study the graph and answer the questions that follow. 28 % that are HIV positive 26 24 22 O 2004 2005 2006 2007 2008 2009 2010 Year 3.6 Describe two trends that you observe when looking at the graph:
The following graph shows the recent HIV status of expecting South African women. Study the graph and answer the questions that follow. 28 % that are HIV positive 26 24 22 O 2004 2005 2006 2007 2008 2009 2010 Year 3.6 Describe two trends that you observe when looking at the graph:

Chapter33: Aspects Of Global Nutrition
Section: Chapter Questions
Problem 4RQ

Related questions
Question
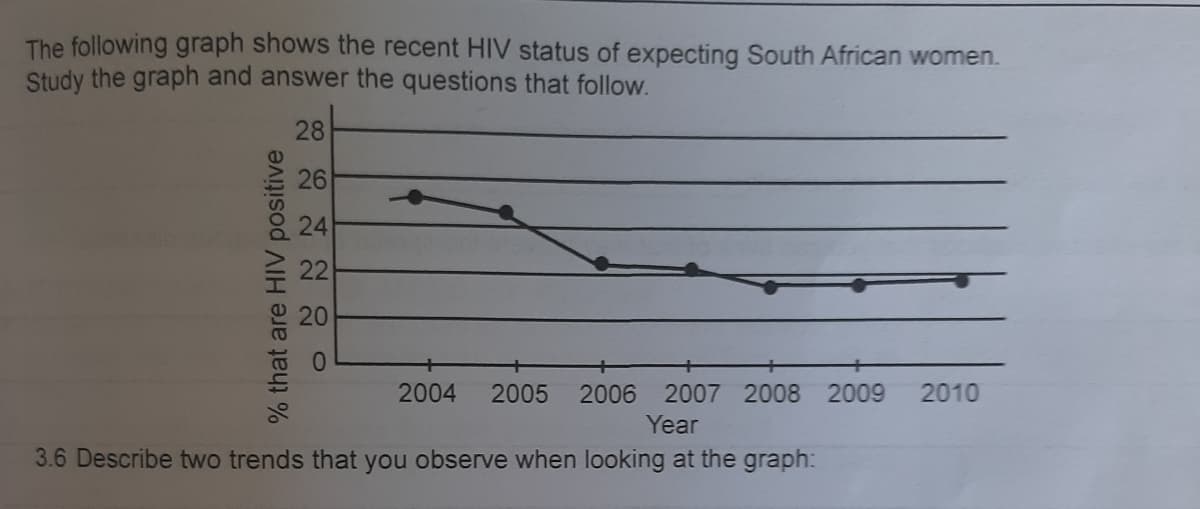
Transcribed Image Text:The following graph shows the recent HIV status of expecting South African women.
Study the graph and answer the questions that follow.
28
% that are HIV positive
26
24
22
O
2004 2005 2006 2007 2008 2009 2010
Year
3.6 Describe two trends that you observe when looking at the graph:
Expert Solution
This question has been solved!
Explore an expertly crafted, step-by-step solution for a thorough understanding of key concepts.

This is a popular solution!

Trending now
This is a popular solution!

Step by step
Solved in 2 steps

Knowledge Booster


Learn more about
Need a deep-dive on the concept behind this application? Look no further. Learn more about this topic, biology and related others by exploring similar questions and additional content below.Recommended textbooks for you
Nutrition Through the Life Cycle (MindTap Course …
Health & Nutrition
ISBN:
9781305628007
Author:
Judith E. Brown
Publisher:
Cengage Learning

Comprehensive Medical Assisting: Administrative a…
Nursing
ISBN:
9781305964792
Author:
Wilburta Q. Lindh, Carol D. Tamparo, Barbara M. Dahl, Julie Morris, Cindy Correa
Publisher:
Cengage Learning
Nutrition Through the Life Cycle (MindTap Course …
Health & Nutrition
ISBN:
9781305628007
Author:
Judith E. Brown
Publisher:
Cengage Learning
Comprehensive Medical Assisting: Administrative a…
Nursing
ISBN:
9781305964792
Author:
Wilburta Q. Lindh, Carol D. Tamparo, Barbara M. Dahl, Julie Morris, Cindy Correa
Publisher:
Cengage Learning