The following is a set of data from a sample of n = 11 items. Complete parts (a) through (c). 1 14 13 15 16 12 10 19 Y 28 26 8 30 32 24 20 38 2 a. Compute the covariance. (Round to three decimal places as needed.) b. Compute the coefficient of correlation. (Do not round until the final answer. Then round to three decimal places as needed.) c. How strong is the relationship between X and Y? Explain. O A. X and Y have a perfect negative correlation because all points fall on a straight line with a negative slope. O B. X and Y have a strong positive correlation because as X increases, Y tends to increase also. O C. X and Y have a perfect positive correlation because all points fall on a straight line with a positive slope. O D. X and Y have no correlation. 124
The following is a set of data from a sample of n = 11 items. Complete parts (a) through (c). 1 14 13 15 16 12 10 19 Y 28 26 8 30 32 24 20 38 2 a. Compute the covariance. (Round to three decimal places as needed.) b. Compute the coefficient of correlation. (Do not round until the final answer. Then round to three decimal places as needed.) c. How strong is the relationship between X and Y? Explain. O A. X and Y have a perfect negative correlation because all points fall on a straight line with a negative slope. O B. X and Y have a strong positive correlation because as X increases, Y tends to increase also. O C. X and Y have a perfect positive correlation because all points fall on a straight line with a positive slope. O D. X and Y have no correlation. 124
Essentials of Business Analytics (MindTap Course List)
2nd Edition
ISBN:9781305627734
Author:Jeffrey D. Camm, James J. Cochran, Michael J. Fry, Jeffrey W. Ohlmann, David R. Anderson
Publisher:Jeffrey D. Camm, James J. Cochran, Michael J. Fry, Jeffrey W. Ohlmann, David R. Anderson
Chapter2: Descriptive Statistics
Section: Chapter Questions
Problem 24P: Five observations taken for two variables follow. a. Develop a scatter diagram with x on the...
Related questions
Question

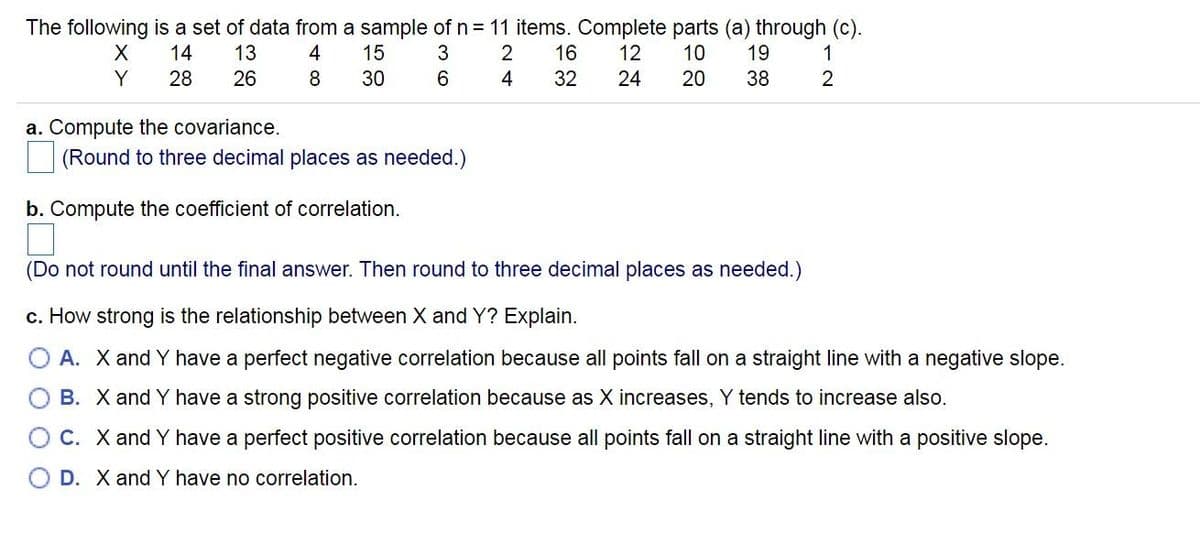
Transcribed Image Text:The following is a set of data from a sample of n= 11 items. Complete parts (a) through (c).
14
13
4
15
3
16
12
10
19
1
Y
28
26
8
30
6
32
24
20
38
2
a. Compute the covariance.
|(Round to three decimal places as needed.)
b. Compute the coefficient of correlation.
(Do not round until the final answer. Then round to three decimal places as needed.)
c. How strong is the relationship between X and Y? Explain.
O A. X and Y have a perfect negative correlation because all points fall on a straight line with a negative slope.
B. X and Y have a strong positive correlation because as X increases, Y tends to increase also.
C. X and Y have a perfect positive correlation because all points fall on a straight line with a positive slope.
D. X and Y have no correlation.
124
Expert Solution
This question has been solved!
Explore an expertly crafted, step-by-step solution for a thorough understanding of key concepts.
This is a popular solution!
Trending now
This is a popular solution!
Step by step
Solved in 3 steps with 2 images

Knowledge Booster
Learn more about
Need a deep-dive on the concept behind this application? Look no further. Learn more about this topic, finance and related others by exploring similar questions and additional content below.Recommended textbooks for you

Essentials of Business Analytics (MindTap Course …
Statistics
ISBN:
9781305627734
Author:
Jeffrey D. Camm, James J. Cochran, Michael J. Fry, Jeffrey W. Ohlmann, David R. Anderson
Publisher:
Cengage Learning

Auditing: A Risk Based-Approach (MindTap Course L…
Accounting
ISBN:
9781337619455
Author:
Karla M Johnstone, Audrey A. Gramling, Larry E. Rittenberg
Publisher:
Cengage Learning

Essentials of Business Analytics (MindTap Course …
Statistics
ISBN:
9781305627734
Author:
Jeffrey D. Camm, James J. Cochran, Michael J. Fry, Jeffrey W. Ohlmann, David R. Anderson
Publisher:
Cengage Learning

Auditing: A Risk Based-Approach (MindTap Course L…
Accounting
ISBN:
9781337619455
Author:
Karla M Johnstone, Audrey A. Gramling, Larry E. Rittenberg
Publisher:
Cengage Learning