The following is market data as of the close of each year for the shares of General Motors (GM) and Microsoft (MSFT). Date Dec 29, 1989 Dec 31 1990 Dec 31 1991 Dec 31 1992 Dec 31 1993 Dec 30 1994 Dec 29 1995 Dec 31 1996 Dec 31 1997 Dec 31 1998 Dec 31 1999 Closing Price US$ 42.3 37.4 30.5 33.7 55.7 42.9 54.0 57.4 66.3 73.6 86.8 GM Métrics Average return Variance of returns Standar Deviation of returns Returns Covariance Returns Correlation Dividend US$ 3.0 1.6 1.4 0.8 0.8 1.1 1.6 5.6 2.0 14.2 According to the data shown, the following is requested: a) Complete following table: GM Closing Price 1.2 2.1 4.6 5.3 5.0 7.6 11.0 20.7 32.3 69.3 116.8 MSFT MSFT Dividend US$ Help: If you notice, there are no scenario probabilities here. Therefore, conventional statistical formulas should be used to use historical data to fill in the blanks.
The following is market data as of the close of each year for the shares of General Motors (GM) and Microsoft (MSFT). Date Dec 29, 1989 Dec 31 1990 Dec 31 1991 Dec 31 1992 Dec 31 1993 Dec 30 1994 Dec 29 1995 Dec 31 1996 Dec 31 1997 Dec 31 1998 Dec 31 1999 Closing Price US$ 42.3 37.4 30.5 33.7 55.7 42.9 54.0 57.4 66.3 73.6 86.8 GM Métrics Average return Variance of returns Standar Deviation of returns Returns Covariance Returns Correlation Dividend US$ 3.0 1.6 1.4 0.8 0.8 1.1 1.6 5.6 2.0 14.2 According to the data shown, the following is requested: a) Complete following table: GM Closing Price 1.2 2.1 4.6 5.3 5.0 7.6 11.0 20.7 32.3 69.3 116.8 MSFT MSFT Dividend US$ Help: If you notice, there are no scenario probabilities here. Therefore, conventional statistical formulas should be used to use historical data to fill in the blanks.

Financial Accounting
15th Edition
ISBN:9781337272124
Author:Carl Warren, James M. Reeve, Jonathan Duchac
Publisher:Carl Warren, James M. Reeve, Jonathan Duchac
Chapter13: Corporations: Organization, Stock Transactions, And Dividends
Section: Chapter Questions
Problem 8PEB

Related questions

Question
100%
COURSE: FINANCE LEVEL 2
Please, see attached files
Thanks
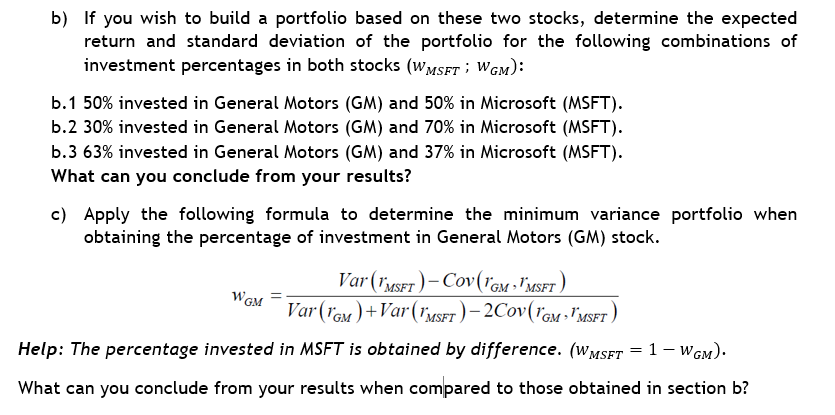
Transcribed Image Text:b) If you wish to build a portfolio based on these two stocks, determine the expected
return and standard deviation of the portfolio for the following combinations of
investment percentages in both stocks (WMSFT; WGM):
b.1 50% invested in General Motors (GM) and 50% in Microsoft (MSFT).
b.2 30% invested in General Motors (GM) and 70% in Microsoft (MSFT).
b.3 63% invested in General Motors (GM) and 37% in Microsoft (MSFT).
What can you conclude from your results?
c) Apply the following formula to determine the minimum variance portfolio when
obtaining the percentage of investment in General Motors (GM) stock.
Var (MSFT)-CoV (GM - MSFT)
Var (GM)+Var (MSFT)-2COV(GM MSFT)
Help: The percentage invested in MSFT is obtained by difference. (WMSFT = 1 - WGM).
What can you conclude from your results when compared to those obtained in section b?
WGM
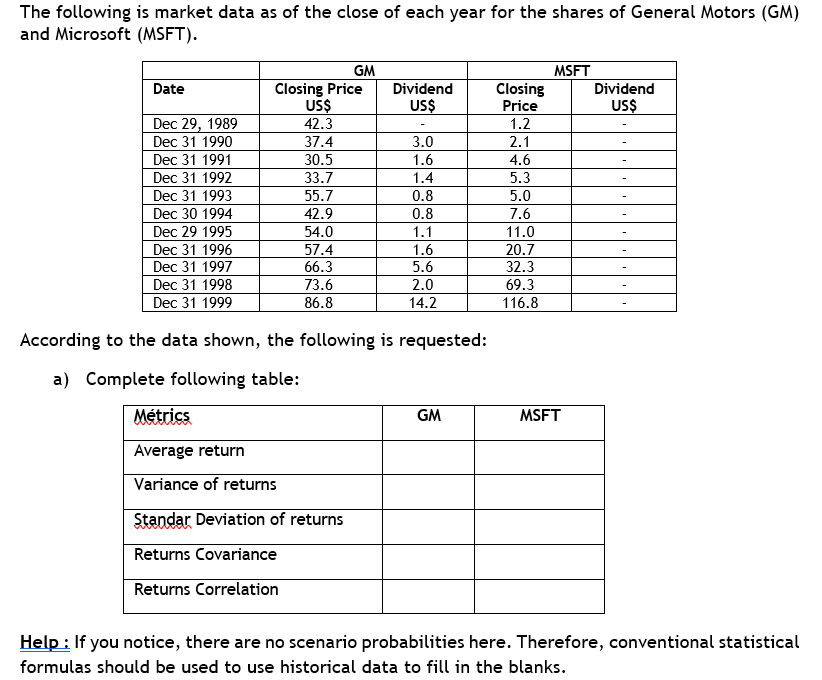
Transcribed Image Text:The following is market data as of the close of each year for the shares of General Motors (GM)
and Microsoft (MSFT).
Date
Dec 29, 1989
Dec 31 1990
Dec 31 1991
Dec 31 1992
Dec 31 1993
Dec 30 1994
Dec 29 1995
Dec 31 1996
Dec 31 1997
Dec 31 1998
Dec 31 1999
Closing Price
US$
42.3
37.4
30.5
33.7
55.7
42.9
54.0
57.4
66.3
73.6
86.8
GM
Métrics
Average return
Variance of returns
Standar Deviation of returns
Returns Covariance
Returns Correlation
Dividend
US$
3.0
1.6
1.4
0.8
0.8
1.1
1.6
5.6
2.0
14.2
According to the data shown, the following is requested:
a) Complete following table:
GM
Closing
Price
1.2
2.1
4.6
5.3
5.0
7.6
11.0
20.7
32.3
69.3
116.8
MSFT
MSFT
Dividend
US$
Help : If you notice, there are no scenario probabilities here. Therefore, conventional statistical
formulas should be used to use historical data to fill in the blanks.
Expert Solution
This question has been solved!
Explore an expertly crafted, step-by-step solution for a thorough understanding of key concepts.

Step by step
Solved in 3 steps with 2 images

Knowledge Booster


Learn more about
Need a deep-dive on the concept behind this application? Look no further. Learn more about this topic, finance and related others by exploring similar questions and additional content below.Recommended textbooks for you
Financial Accounting
Accounting
ISBN:
9781337272124
Author:
Carl Warren, James M. Reeve, Jonathan Duchac
Publisher:
Cengage Learning

Financial Accounting
Accounting
ISBN:
9781305088436
Author:
Carl Warren, Jim Reeve, Jonathan Duchac
Publisher:
Cengage Learning

Financial Accounting: The Impact on Decision Make…
Accounting
ISBN:
9781305654174
Author:
Gary A. Porter, Curtis L. Norton
Publisher:
Cengage Learning
Financial Accounting
Accounting
ISBN:
9781337272124
Author:
Carl Warren, James M. Reeve, Jonathan Duchac
Publisher:
Cengage Learning
Financial Accounting
Accounting
ISBN:
9781305088436
Author:
Carl Warren, Jim Reeve, Jonathan Duchac
Publisher:
Cengage Learning
Financial Accounting: The Impact on Decision Make…
Accounting
ISBN:
9781305654174
Author:
Gary A. Porter, Curtis L. Norton
Publisher:
Cengage Learning

Managerial Accounting: The Cornerstone of Busines…
Accounting
ISBN:
9781337115773
Author:
Maryanne M. Mowen, Don R. Hansen, Dan L. Heitger
Publisher:
Cengage Learning

Intermediate Accounting: Reporting And Analysis
Accounting
ISBN:
9781337788281
Author:
James M. Wahlen, Jefferson P. Jones, Donald Pagach
Publisher:
Cengage Learning

College Accounting, Chapters 1-27
Accounting
ISBN:
9781337794756
Author:
HEINTZ, James A.
Publisher:
Cengage Learning,