The following results are from a regression where the dependent variable is GRADUATION RATE and the independent variables are % OF CLASSES UNDER 20, % OF CLASSES OF 50 OR MORE, STUDENT/FACULTY RATIO, ACCEPTANCE RATE, 1ST YEAR STUDENTS IN TOP 10% OF HS CLASS. *see below* Below is the regression of % OF CLASSES UNDER 20 on the other independent variables. *see below* a) Calculate the VIF for % OF CLASSES UNDER 20. b) Based on the VIF, do you think that multicollinearity is a problem? Explain.
The following results are from a regression where the dependent variable is GRADUATION RATE and the independent variables are % OF CLASSES UNDER 20, % OF CLASSES OF 50 OR MORE, STUDENT/FACULTY RATIO, ACCEPTANCE RATE, 1ST YEAR STUDENTS IN TOP 10% OF HS CLASS. *see below* Below is the regression of % OF CLASSES UNDER 20 on the other independent variables. *see below* a) Calculate the VIF for % OF CLASSES UNDER 20. b) Based on the VIF, do you think that multicollinearity is a problem? Explain.

Algebra & Trigonometry with Analytic Geometry
13th Edition
ISBN:9781133382119
Author:Swokowski
Publisher:Swokowski
Chapter5: Inverse, Exponential, And Logarithmic Functions
Section5.6: Exponential And Logarithmic Equations
Problem 67E

Related questions
Question
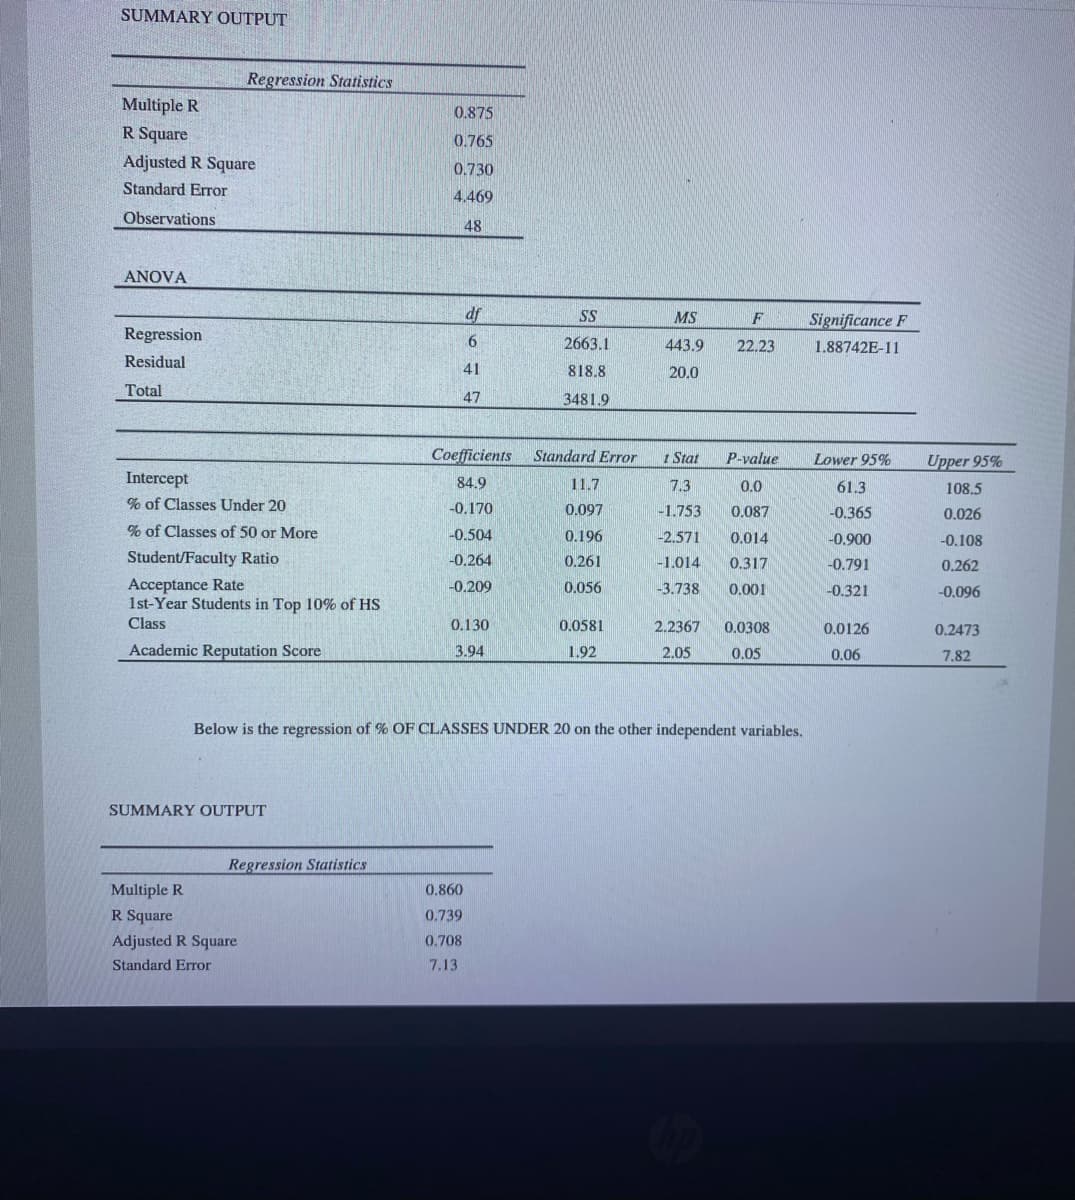
8) The following results are from a regression where the dependent variable is GRADUATION RATE and the independent variables are % OF CLASSES UNDER 20, % OF CLASSES OF 50 OR MORE, STUDENT/FACULTY RATIO, ACCEPTANCE RATE, 1ST YEAR STUDENTS IN TOP 10% OF HS CLASS.
*see below*
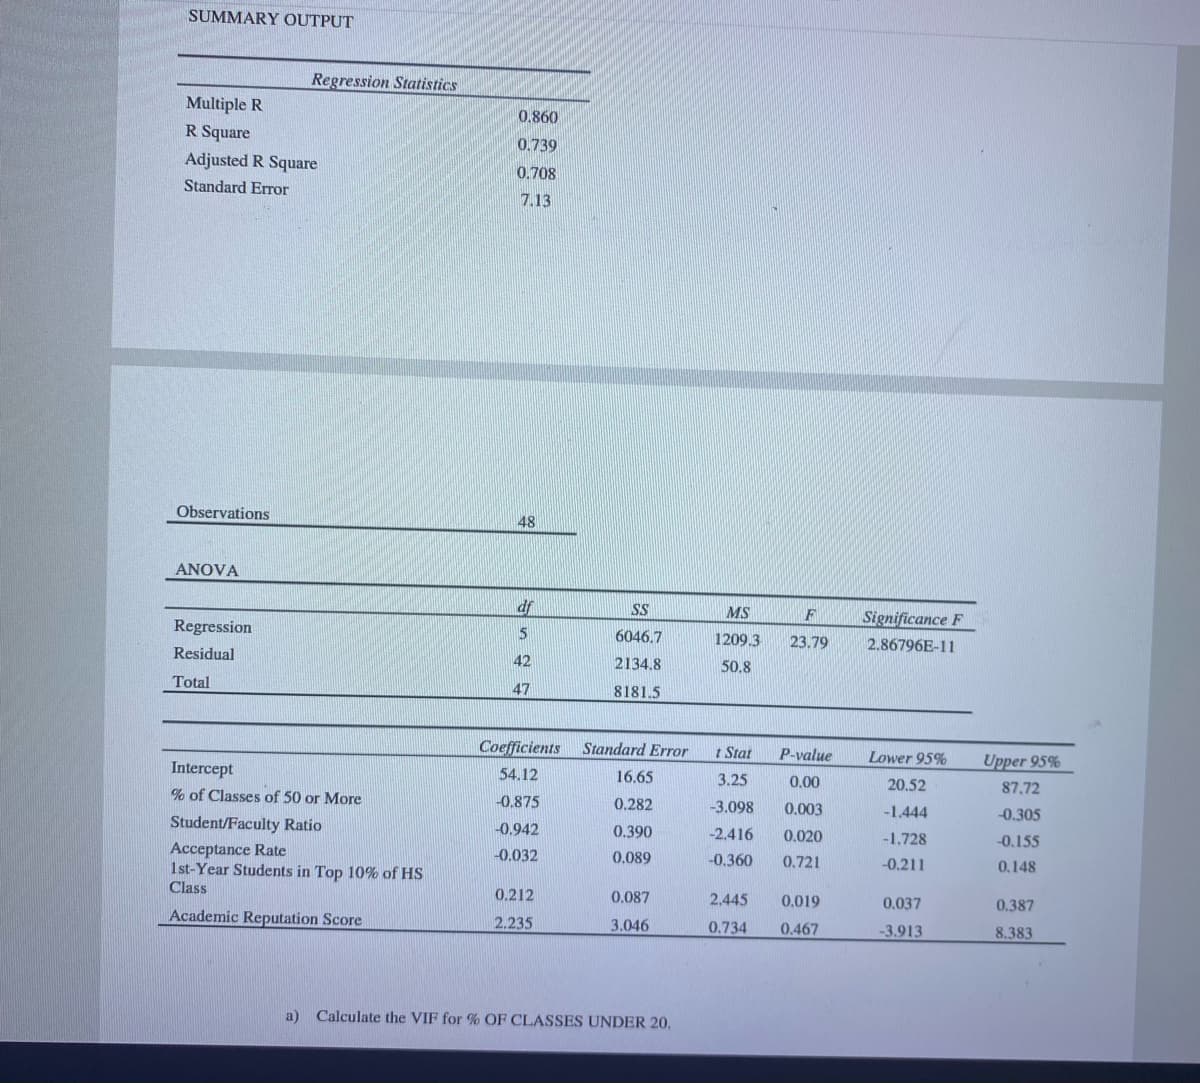
Below is the regression of % OF CLASSES UNDER 20 on the other independent variables.
*see below*
a) Calculate the VIF for % OF CLASSES UNDER 20.
b) Based on the VIF, do you think that multicollinearity is a problem? Explain.
Transcribed Image Text:SUMMARY OUTPUT
Regression Statistics
Multiple R
0.875
R Square
0.765
Adjusted R Square
0.730
Standard Error
4.469
Observations
48
ANOVA
df
SS
MS
Significance F
F
Regression
2663.1
443.9
22.23
1.88742E-11
Residual
41
818.8
20.0
Total
47
3481.9
Coefficients Standard Error
I Stat
P-value
Lower 95%
Upper 95%
Intercept
84.9
11.7
7.3
0.0
61.3
108.5
% of Classes Under 20
-0.170
0.097
-1.753
0.087
-0.365
0.026
% of Classes of 50 or More
-0.504
0.196
-2.571
0.014
-0.900
-0.108
Student/Faculty Ratio
-0.264
0.261
-1.014
0.317
-0.791
0.262
Acceptance Rate
1st-Year Students in Top 10% of HS
-0.209
0.056
-3.738
0.001
0.321
-0.096
Class
0.130
0.0581
2.2367
0.0308
0.0126
0.2473
Academic Reputation Score
3.94
1.92
2.05
0.05
0.06
7.82
Below is the regression of % OF CLASSES UNDER 20 on the other independent variables.
SUMMARY OUTPUT
Regression Statistics
Multiple R
0.860
R Square
0.739
Adjusted R Square
0.708
Standard Error
7.13
Transcribed Image Text:SUMMARY OUTPUT
Regression Statistics
Multiple R
0.860
R Square
0.739
Adjusted R Square
0.708
Standard Error
7.13
Observations
48
ANOVA
df
SS
MS
Significance F
Regression
6046.7
1209.3
23.79
2.86796E-11
Residual
42
2134.8
50.8
Total
47
8181.5
Coefficients
Standard Error
t Stat
P-value
Lower 95%
Upper 95%
Intercept
54.12
16.65
3.25
0.00
20.52
87.72
% of Classes of 50 or More
-0.875
0,282
-3.098
0.003
-1.444
-0.305
Student/Faculty Ratio
-0.942
0.390
-2,416
0.020
-1.728
-0.155
Acceptance Rate
1st-Year Students in Top 10% of HS
Class
-0.032
0.089
-0.360
0.721
-0.211
0.148
0.212
0.087
2.445
0,019
0.037
0.387
Academic Reputation Score
2.235
3.046
0.734
0.467
-3.913
8.383
a) Calculate the VIF for % OF CLASSES UNDER 20,
Expert Solution
This question has been solved!
Explore an expertly crafted, step-by-step solution for a thorough understanding of key concepts.

Step by step
Solved in 2 steps with 1 images

Recommended textbooks for you
Algebra & Trigonometry with Analytic Geometry
Algebra
ISBN:
9781133382119
Author:
Swokowski
Publisher:
Cengage

Linear Algebra: A Modern Introduction
Algebra
ISBN:
9781285463247
Author:
David Poole
Publisher:
Cengage Learning
Algebra & Trigonometry with Analytic Geometry
Algebra
ISBN:
9781133382119
Author:
Swokowski
Publisher:
Cengage
Linear Algebra: A Modern Introduction
Algebra
ISBN:
9781285463247
Author:
David Poole
Publisher:
Cengage Learning