The following scatterplot shows the relationship between x and y in a simple linear regression model. SCATTER PLOT -1.5 -2 ➤-25 -3 -3.5 4 100 200 300 X 400 500 The R2 for the model is calculated as 0.63. What is the simple correlation coefficient (r) between x and y? r=
The following scatterplot shows the relationship between x and y in a simple linear regression model. SCATTER PLOT -1.5 -2 ➤-25 -3 -3.5 4 100 200 300 X 400 500 The R2 for the model is calculated as 0.63. What is the simple correlation coefficient (r) between x and y? r=

Chapter4: Linear Functions
Section: Chapter Questions
Problem 41RE: For the following exercises, consider the data in Table 5, which shows the percent of unemployed in...

Related questions
Question
M3
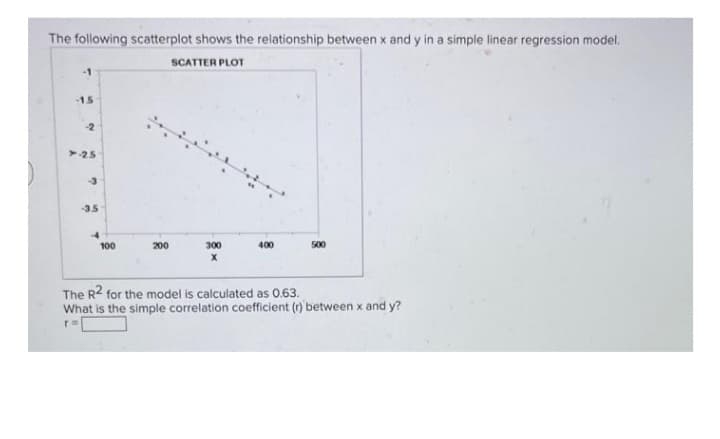
Transcribed Image Text:The following scatterplot shows the relationship between x and y in a simple linear regression model.
SCATTER PLOT
-1
-1.5
-2
➤-25
-3
-3.5
4
100
200
300
X
400
500
The R2 for the model is calculated as 0.63.
What is the simple correlation coefficient (r) between x and y?
r=
Expert Solution
This question has been solved!
Explore an expertly crafted, step-by-step solution for a thorough understanding of key concepts.

Step by step
Solved in 2 steps with 2 images

Recommended textbooks for you

Glencoe Algebra 1, Student Edition, 9780079039897…
Algebra
ISBN:
9780079039897
Author:
Carter
Publisher:
McGraw Hill

Functions and Change: A Modeling Approach to Coll…
Algebra
ISBN:
9781337111348
Author:
Bruce Crauder, Benny Evans, Alan Noell
Publisher:
Cengage Learning
Glencoe Algebra 1, Student Edition, 9780079039897…
Algebra
ISBN:
9780079039897
Author:
Carter
Publisher:
McGraw Hill
Functions and Change: A Modeling Approach to Coll…
Algebra
ISBN:
9781337111348
Author:
Bruce Crauder, Benny Evans, Alan Noell
Publisher:
Cengage Learning

College Algebra
Algebra
ISBN:
9781305115545
Author:
James Stewart, Lothar Redlin, Saleem Watson
Publisher:
Cengage Learning