The following table gives the mean monthly temperatures for Windsor, a city in Ontario. Each month is represented by the day of the year in the middle of the month. Month Feb. Mar. Apr. May June July Aug. Sep. Oct. Nov. Dec. 15 45 75 106 136 167 197 228 259 289 320 350 Jan. Day of Year Temperature for Windsor (°C) a) Create a scatter plot of mean monthly temperature versus day of the year for the city. Draw the curve of best fit for the graph -4.7 -3.8 2.3 8.7 14.6 20.2 22.6 22.0 17.9 11.5 4.8 -1.2 b) Use the graph to estimate when the mean daily temperature is maximum. c) Use the graph to determine the amplitude, period, and equation of the axis for the above graph d) Determine an equation of a sinusoidal function to model the data for the city. e) Use the graph to determine when the mean daily temperature exceeds 12 °C for Windsor.
The following table gives the mean monthly temperatures for Windsor, a city in Ontario. Each month is represented by the day of the year in the middle of the month. Month Feb. Mar. Apr. May June July Aug. Sep. Oct. Nov. Dec. 15 45 75 106 136 167 197 228 259 289 320 350 Jan. Day of Year Temperature for Windsor (°C) a) Create a scatter plot of mean monthly temperature versus day of the year for the city. Draw the curve of best fit for the graph -4.7 -3.8 2.3 8.7 14.6 20.2 22.6 22.0 17.9 11.5 4.8 -1.2 b) Use the graph to estimate when the mean daily temperature is maximum. c) Use the graph to determine the amplitude, period, and equation of the axis for the above graph d) Determine an equation of a sinusoidal function to model the data for the city. e) Use the graph to determine when the mean daily temperature exceeds 12 °C for Windsor.

Glencoe Algebra 1, Student Edition, 9780079039897, 0079039898, 2018
18th Edition
ISBN:9780079039897
Author:Carter
Publisher:Carter
Chapter10: Statistics
Section10.4: Distributions Of Data
Problem 19PFA

Related questions
Question
Complete the question below.
Justify your answers with sufficent explaination using words.
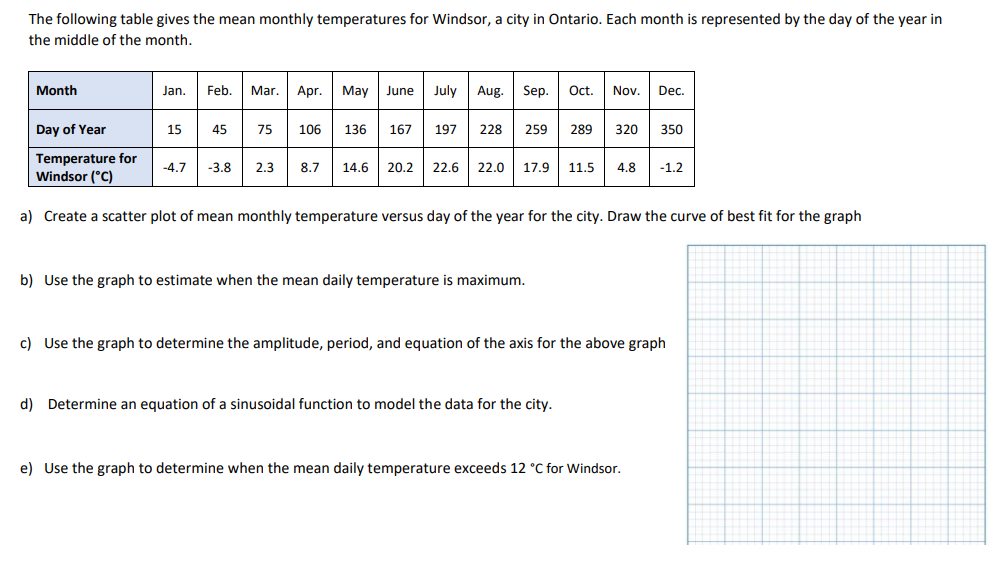
Transcribed Image Text:The following table gives the mean monthly temperatures for Windsor, a city in Ontario. Each month is represented by the day of the year in
the middle of the month.
Month
Day of Year
Temperature for
Windsor (°C)
Jan.
15
Feb. Mar. Apr.
45 75 106 136 167
-4.7 -3.8 2.3
May June
8.7
July Aug. Sep. Oct. Nov. Dec.
197 228
14.6 20.2 22.6 22.0
259 289 320 350
17.9 11.5 4.8 -1.2
a) Create a scatter plot of mean monthly temperature versus day of the year for the city. Draw the curve of best fit for the graph
b) Use the graph to estimate when the mean daily temperature is maximum.
c) Use the graph to determine the amplitude, period, and equation of the axis for the above graph
d) Determine an equation of a sinusoidal function to model the data for the city.
e) Use the graph to determine when the mean daily temperature exceeds 12 °C for Windsor.
Expert Solution
This question has been solved!
Explore an expertly crafted, step-by-step solution for a thorough understanding of key concepts.

This is a popular solution!

Trending now
This is a popular solution!

Step by step
Solved in 4 steps with 3 images

Follow-up Questions
Read through expert solutions to related follow-up questions below.
Recommended textbooks for you
Glencoe Algebra 1, Student Edition, 9780079039897…
Algebra
ISBN:
9780079039897
Author:
Carter
Publisher:
McGraw Hill

Functions and Change: A Modeling Approach to Coll…
Algebra
ISBN:
9781337111348
Author:
Bruce Crauder, Benny Evans, Alan Noell
Publisher:
Cengage Learning
Glencoe Algebra 1, Student Edition, 9780079039897…
Algebra
ISBN:
9780079039897
Author:
Carter
Publisher:
McGraw Hill
Functions and Change: A Modeling Approach to Coll…
Algebra
ISBN:
9781337111348
Author:
Bruce Crauder, Benny Evans, Alan Noell
Publisher:
Cengage Learning