The following table gives the total number of U.S adults with diabetes for selected years from 2010 and projected to 2050. Year Number (millions) 2010 2015 2020 2025 32.3 37.3 50.0 59.5 2030 2035 2040 68.3 76.2 84.1 2045 91.7 2050 100.0 a. Find the logistic function that models these data. Use x equal to the number of years past 2000 and report your model with coefficients rounded to three decimals places.
The following table gives the total number of U.S adults with diabetes for selected years from 2010 and projected to 2050. Year Number (millions) 2010 2015 2020 2025 32.3 37.3 50.0 59.5 2030 2035 2040 68.3 76.2 84.1 2045 91.7 2050 100.0 a. Find the logistic function that models these data. Use x equal to the number of years past 2000 and report your model with coefficients rounded to three decimals places.

Chapter6: Exponential And Logarithmic Functions
Section6.8: Fitting Exponential Models To Data
Problem 3TI: Table 6 shows the population, in thousands, of harbor seals in the Wadden Sea over the years 1997 to...

Related questions
Question
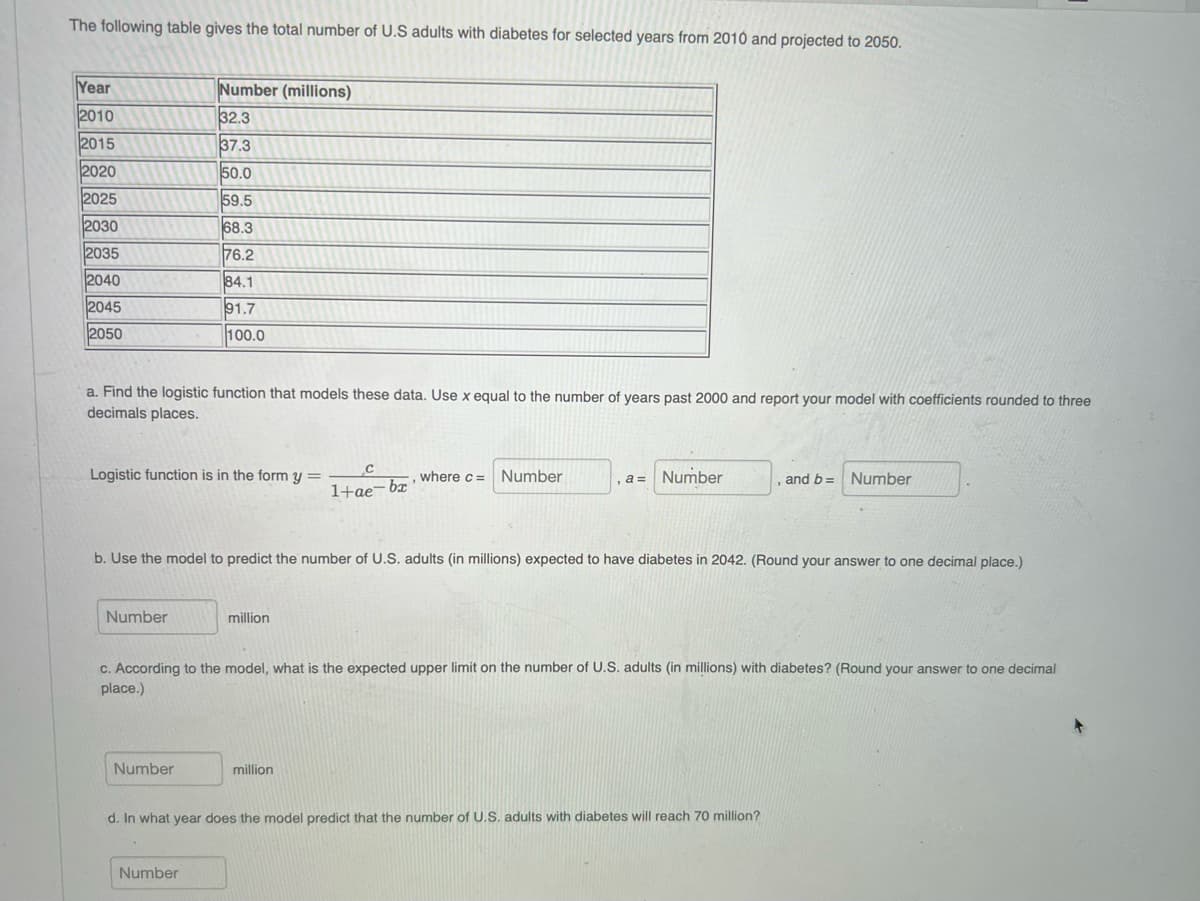
Transcribed Image Text:The following table gives the total number of U.S adults with diabetes for selected years from 2010 and projected to 2050.
Year
2010
Number (millions)
32.3
2015
37.3
2020
2025
50.0
59.5
2030
68.3
2035
76.2
84.1
91.7
2040
2045
2050
100.0
a. Find the logistic function that models these data. Use x equal to the number of years past 2000 and report your model with coefficients rounded to three
decimals places.
Logistic function is in the form y =
where c =
Number
, a= Number
Number
and b=
1+ae¬bx
b. Use the model to predict the number of U.S. adults (in millions) expected to have diabetes in 2042. (Round your answer to one decimal place.)
Number
million
C. According to the model, what is the expected upper limit on the number of U.S. adults (in millions) with diabetes? (Round your answer to one decimal
place.)
Number
million
d. In what year does the model predict that the number of U.S. adults with diabetes will reach 70 million?
Number
Expert Solution
This question has been solved!
Explore an expertly crafted, step-by-step solution for a thorough understanding of key concepts.

This is a popular solution!

Trending now
This is a popular solution!

Step by step
Solved in 3 steps with 1 images

Recommended textbooks for you

Linear Algebra: A Modern Introduction
Algebra
ISBN:
9781285463247
Author:
David Poole
Publisher:
Cengage Learning

Algebra & Trigonometry with Analytic Geometry
Algebra
ISBN:
9781133382119
Author:
Swokowski
Publisher:
Cengage
Linear Algebra: A Modern Introduction
Algebra
ISBN:
9781285463247
Author:
David Poole
Publisher:
Cengage Learning
Algebra & Trigonometry with Analytic Geometry
Algebra
ISBN:
9781133382119
Author:
Swokowski
Publisher:
Cengage