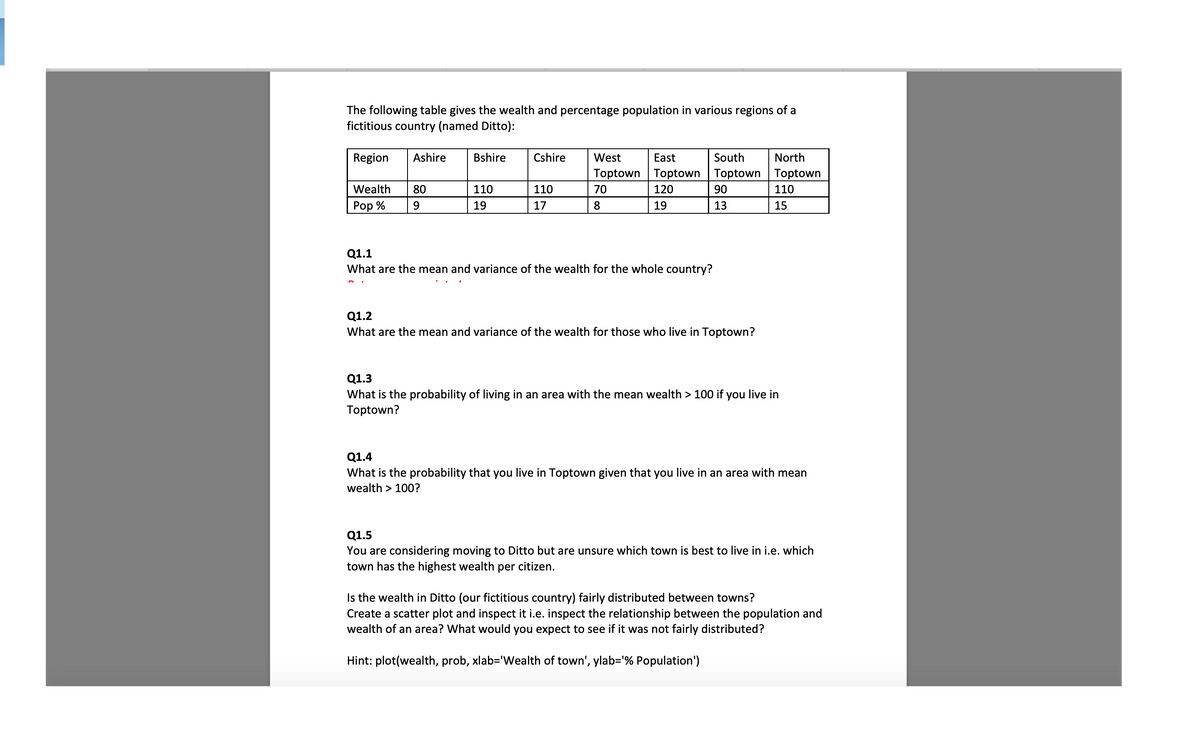
The following table gives the wealth and percentage population in various regions of a fictitious country (named Ditto): Region Ashire Bshire Cshire West East South North Toptown Toptown Toptown Toptown Wealth Pop % 80 110 110 70 120 90 110 19 17 8 19 13 15 Q1.1 What are the mean and variance of the wealth for the whole country? Q1.2 What are the mean and variance of the wealth for those who live in Toptown? Q1.3 What is the probability of living in an area with the mean wealth > 100 if you live in Toptown?


Inverse Normal Distribution
The method used for finding the corresponding z-critical value in a normal distribution using the known probability is said to be an inverse normal distribution. The inverse normal distribution is a continuous probability distribution with a family of two parameters.
Mean, Median, Mode
It is a descriptive summary of a data set. It can be defined by using some of the measures. The central tendencies do not provide information regarding individual data from the dataset. However, they give a summary of the data set. The central tendency or measure of central tendency is a central or typical value for a probability distribution.
Z-Scores
A z-score is a unit of measurement used in statistics to describe the position of a raw score in terms of its distance from the mean, measured with reference to standard deviation from the mean. Z-scores are useful in statistics because they allow comparison between two scores that belong to different normal distributions.

Step by step
Solved in 4 steps


