The following table shows, for a certain chemical reaction, the rate of reaction R, in moles per cubic meter per second, as a function of the concentration x, in moles per cubic meter, of the product. Concentration x Reaction rate R 10 20 30 40 50 2 17 13 (a) Use quadratic regression to find a model for the data. Round regression parameters to three decimal places. R = (b) Use your model to estimate R(23). (Round your answer to two decimal places.) R(23) = moles per cubic meter per second Explain vhat your answer means. The reaction rate at a concentration of 23 moles per cubic meter is |moles per cubic meter per second. (c) Estimate the concentration at which the reaction rate is 4 moles per cubic meter per second. (Consider concentrations only up to a level of 50 moles per cubic meter. Round your answer to two decimal places.) moles per cubic centimeter
The following table shows, for a certain chemical reaction, the rate of reaction R, in moles per cubic meter per second, as a function of the concentration x, in moles per cubic meter, of the product. Concentration x Reaction rate R 10 20 30 40 50 2 17 13 (a) Use quadratic regression to find a model for the data. Round regression parameters to three decimal places. R = (b) Use your model to estimate R(23). (Round your answer to two decimal places.) R(23) = moles per cubic meter per second Explain vhat your answer means. The reaction rate at a concentration of 23 moles per cubic meter is |moles per cubic meter per second. (c) Estimate the concentration at which the reaction rate is 4 moles per cubic meter per second. (Consider concentrations only up to a level of 50 moles per cubic meter. Round your answer to two decimal places.) moles per cubic centimeter

Chapter4: Linear Functions
Section4.3: Fitting Linear Models To Data
Problem 34SE: For the following exercises, consider this scenario: The profit of a company decreased steadily...

Related questions

Concept explainers
Contingency Table
A contingency table can be defined as the visual representation of the relationship between two or more categorical variables that can be evaluated and registered. It is a categorical version of the scatterplot, which is used to investigate the linear relationship between two variables. A contingency table is indeed a type of frequency distribution table that displays two variables at the same time.
Binomial Distribution
Binomial is an algebraic expression of the sum or the difference of two terms. Before knowing about binomial distribution, we must know about the binomial theorem.
Topic Video
Question
13
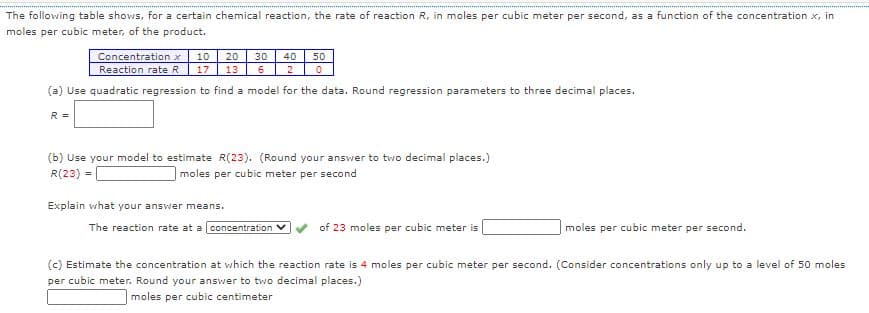
Transcribed Image Text:The following table shows, for a certain chemical reaction, the rate of reaction R, in moles per cubic meter per second, as a function of the concentration x, in
moles per cubic meter, of the product.
Concentration x
Reaction rate R
10
20
30
40
50
17
13
2
(a) Use quadratic regression to find a model for the data. Round regression parameters to three decimal places.
R =
(b) Use your model to estimate R(23). (Round your answer to two decimal places.)
R(23) =
moles per cubic meter per second
Explain what your answer means.
The reaction rate at a l concentration V
of 23 moles per cubic meter is
moles per cubic meter per second.
(c) Estimate the concentration at which the reaction rate is 4 moles per cubic meter per second. (Consider concentrations only up to a level of 50 moles
per cubic meter. Round your answer to two decimal places.)
moles per cubic centimeter
Expert Solution
This question has been solved!
Explore an expertly crafted, step-by-step solution for a thorough understanding of key concepts.

This is a popular solution!

Trending now
This is a popular solution!

Step by step
Solved in 5 steps

Knowledge Booster


Learn more about
Need a deep-dive on the concept behind this application? Look no further. Learn more about this topic, advanced-math and related others by exploring similar questions and additional content below.Recommended textbooks for you

Algebra & Trigonometry with Analytic Geometry
Algebra
ISBN:
9781133382119
Author:
Swokowski
Publisher:
Cengage

Algebra and Trigonometry (MindTap Course List)
Algebra
ISBN:
9781305071742
Author:
James Stewart, Lothar Redlin, Saleem Watson
Publisher:
Cengage Learning
Algebra & Trigonometry with Analytic Geometry
Algebra
ISBN:
9781133382119
Author:
Swokowski
Publisher:
Cengage
Algebra and Trigonometry (MindTap Course List)
Algebra
ISBN:
9781305071742
Author:
James Stewart, Lothar Redlin, Saleem Watson
Publisher:
Cengage Learning