The following table shows the number of new (single-unit) houses started, in thousands, in the different regions of the United States during 2012-2014.t Take S to be the set of all housing starts represented in the table, and label the sets representing the housing starts in each row and column as shown (so, for example, N is the set of all housing starts in the Northeast during 2012-2014). Northeast (N) Midwest South (M) West Total (S) (W) 2012 (A) 50 90 280 110 530 2013 (B) 60 100 330 130 620 2014 (C) 50 110 350 150 660 Total 160 300 960 390 1,810 Use symbols to describe the given set. the set of housing starts in 2013 excluding housing starts in the the West O Bnw ocnw O AUW O BUW O ANw Compute its cardinality x thousand
The following table shows the number of new (single-unit) houses started, in thousands, in the different regions of the United States during 2012-2014.t Take S to be the set of all housing starts represented in the table, and label the sets representing the housing starts in each row and column as shown (so, for example, N is the set of all housing starts in the Northeast during 2012-2014). Northeast (N) Midwest South (M) West Total (S) (W) 2012 (A) 50 90 280 110 530 2013 (B) 60 100 330 130 620 2014 (C) 50 110 350 150 660 Total 160 300 960 390 1,810 Use symbols to describe the given set. the set of housing starts in 2013 excluding housing starts in the the West O Bnw ocnw O AUW O BUW O ANw Compute its cardinality x thousand

Algebra and Trigonometry (MindTap Course List)
4th Edition
ISBN:9781305071742
Author:James Stewart, Lothar Redlin, Saleem Watson
Publisher:James Stewart, Lothar Redlin, Saleem Watson
Chapter14: Counting And Probability
Section14.CR: Chapter Review
Problem 2CC

Related questions
Question
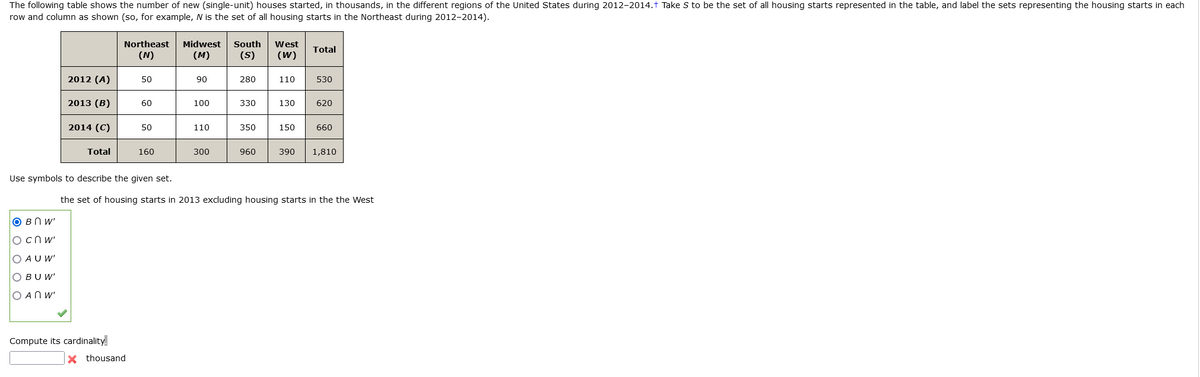
Transcribed Image Text:The following table shows the number of new (single-unit) houses started, in thousands, in the different regions of the United States during 2012-2014.t Take S to be the set of all housing starts represented in the table, and label the sets representing the housing starts in each
row and column as shown (so, for example, N is the set of all housing starts in the Northeast during 2012-2014).
Midwest South West
(S)
Northeast
Total
(N)
(M)
(W)
2012 (A)
50
90
280
110
530
2013 (В)
60
100
330
130
620
2014 (C)
50
110
350
150
660
Total
160
300
960
390
1,810
Use symbols to describe the given set.
the set of housing starts in 2013 excluding housing starts in the the West
O BN W'
Ocn w'
O AU W'
OBUW'
O AN W'
Compute its cardinality.
X thousand
Expert Solution
This question has been solved!
Explore an expertly crafted, step-by-step solution for a thorough understanding of key concepts.

This is a popular solution!

Trending now
This is a popular solution!

Step by step
Solved in 2 steps with 2 images

Recommended textbooks for you
Algebra and Trigonometry (MindTap Course List)
Algebra
ISBN:
9781305071742
Author:
James Stewart, Lothar Redlin, Saleem Watson
Publisher:
Cengage Learning

Elements Of Modern Algebra
Algebra
ISBN:
9781285463230
Author:
Gilbert, Linda, Jimmie
Publisher:
Cengage Learning,
Algebra and Trigonometry (MindTap Course List)
Algebra
ISBN:
9781305071742
Author:
James Stewart, Lothar Redlin, Saleem Watson
Publisher:
Cengage Learning
Elements Of Modern Algebra
Algebra
ISBN:
9781285463230
Author:
Gilbert, Linda, Jimmie
Publisher:
Cengage Learning,