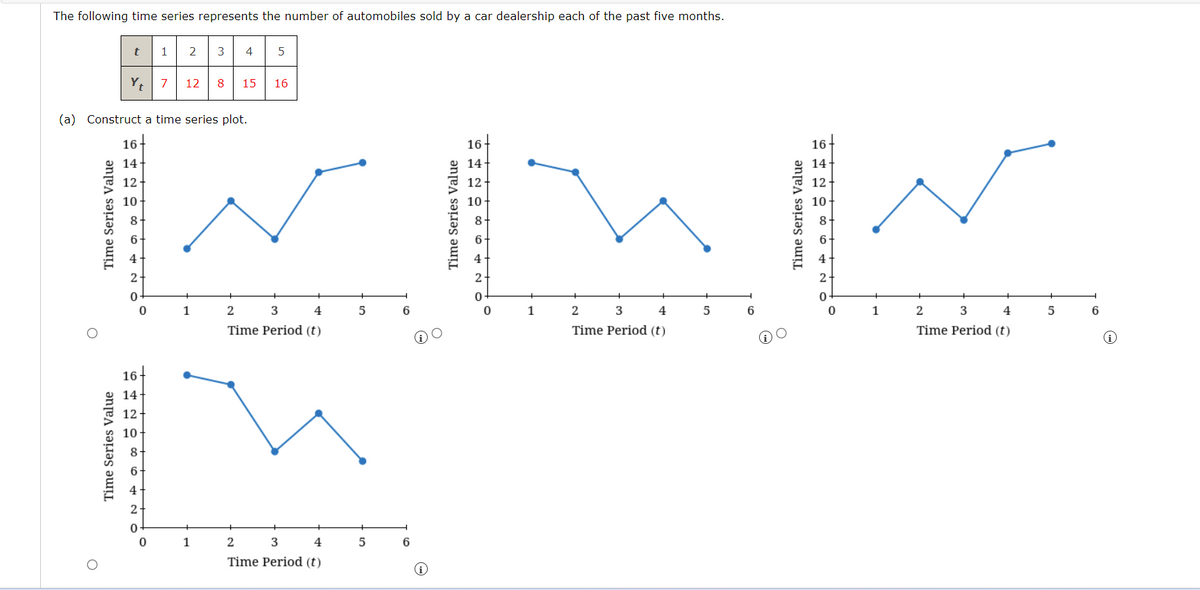
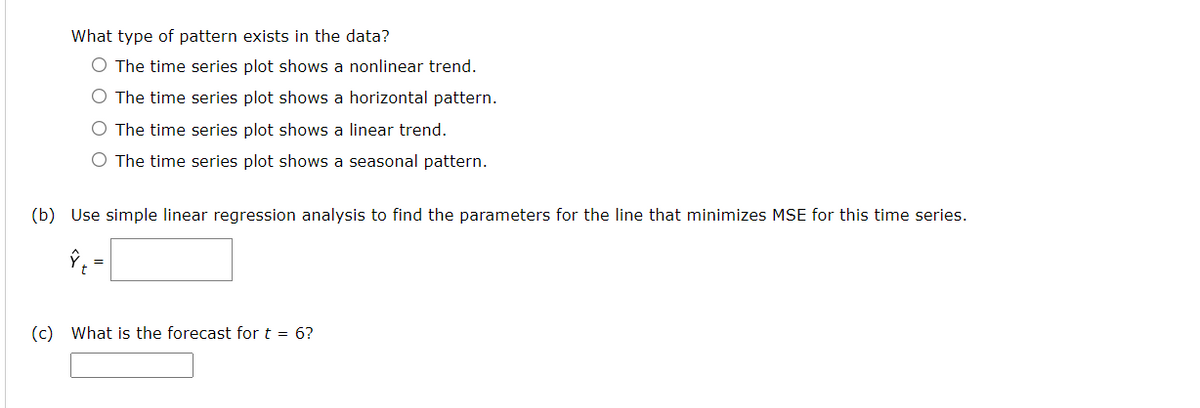
The following time series represents the number of automobiles sold by a car dealership each of the past five months. O t O (a) Construct a time series plot. Time Series Value 12 INIWIN 10 8 6 4 Y₁ 7 12 8 15 16 16 14- 12 10- 8- 6 14- 12 10 ON 4900 1 2 3 8. 6 0 4 5 1 1 2 3 4 Time Period (t) 2 3 4 Time Period (t) 5 5 6 16- 14 0 1 + 3 2 4 Time Period (t) 5 6 16- 14- 12 10 8- 1 2 3 4 Time Period (t) 5 What type of pattern exists in the data? O The time series plot shows a nonlinear trend. O The time series plot shows a horizontal pattern. O The time series plot shows a linear trend. O The time series plot shows a seasonal pattern. (b) Use simple linear regression analysis to find the parameters for the line that minimizes MSE for this time series. (c) What is the forecast for t = 6?


Q: True or false? Operations management is focused primarily on the application of technology in…
A: Operation management is a process that involves shaping, running, and maintaining processes which…
Q: Alpha Sennon | Ashoka | Everyone a Changemaker Identify and discuss at least 4 Characteristics and…
A: Alpha Sennon exemplifies the traits and skill sets commonly associated with successful social…
Q: Part 1 Sam's Pet Hotel operates 52 weeks per year, 6 days per week, and uses a continuous review…
A: Inventory management includes a regular view of inventory management and supply chain management…
Q: Could you please check my thesis paper and see if I am on the right track. Thank you Thesis…
A: Your thesis paper delves into the multifaceted social issues and challenges confronting immigrants…
Q: One crucial aspect of management involves fostering a culture of continuous improvement within…
A: Continuous improvement is based on the principles of Kaizen, This approach emphasizes the…
Q: Corporate triple-A bond interest rates for 12 consecutive months follow. (a) Construct a time series…
A: a. The correct answer is a horizontal data pattern wherein the data fluctuates around a constant…
Q: Blue Lagoon is a contractor that installs residential swimming pools, projects that consist of nine…
A: Find the given details below:Note that you have submitted multiple questions at a time, as per the…
Q: how does quality management contribute to enhancing customer satisfaction and loyalty?
A: Quality management is the act of supervising numerous roles and operations inside a company to…
Q: Activity Estimated Duration ABCDEFGH 6 3 225 AWN2 3 4 3 Crash Time 3 2 2 2 2 2 3 2 Cost per Week 600…
A: To determine the most cost-effective way to expedite Cherry's project, I will use the crash time and…
Q: Note:- Do not provide handwritten solution. Maintain accuracy and quality in your answer. Take care…
A: The objective of the question is to understand the various pressures that decision makers in public…
Q: Please read the case study below and answer ALL questions.Q Tupperware Could Go Out Of Business,…
A: The objective of this question is to analyze the business environment issues that Tupperware is…
Q: In the model shown below, decisions about investments in research and development across three…
A: Linear programming is a mathematical method used to find the best possible outcome or solution from…
Q: Consider the following linear program: Max 1A + 2B 1A <5 1B < 5 2A + 2B = 12 Show the…
A: Find the given details below:Objective Function:Constraints:Subject to
Q: plessss
A: Productivity is a key indicator of how effectively and efficiently resources are used to generate…
Q: Discuss the implications of global manufacturing trends on production system design.
A: Production system design is creating a mechanism for production. It's similar to creating a map…
Q: Live Trap Corporation received the data below for its rodent cage production unit. OUTPUT 49,620…
A: I have solved the problem using Excel and Here are the Excel formulas:
Q: The employee credit union at State University is planning the allocation of funds for the coming…
A: The information provided is stated in the table below:Automobile LoanFurniture LoanOther secured…
Q: Products or technologies that have not been tested against customer needs do not generate value. A.…
A: In today's competitive market landscape, every organization must understand customer needs, Knowing…
Q: (Zavi 1976) Consider the economic lot size model with infinite horizon and deterministic demand D…
A: Ans step 1 In this scenario we'll apply the basic Economic Production Quantity (EPQ) model with…
Q: SOLVE STEP BY STEP IN DIGITAL FORMAT Precedents A B C C A, E, F A, E, F D H, I, G Activity A BCDEFGH…
A: Find the given details below:Note that, there are discrepancies between precedents and later acts,…
Q: Can you show how to put it in Excel? XYZ store sells regular and premium nut mixes. Premium mix…
A: Linear programming is a mathematical optimization technique utilized to choose the best output in a…
Q: Which of the following ethical principles is being demonstrated when a researcher adaptsmethods to…
A: The objective of the question is to identify the ethical principle that is being demonstrated when a…
Q: Schedule the following activities using CPM: ACTIVITY IMMEDIATE PREDECESSOR ABCD А DO с A AU E F G H…
A:
Q: Use regression and seasonal indexes to forecast quarterly sales for the next year. Note: Do not…
A: statics is an art and science both based on factors and conclusion The numeracy of data under…
Q: The following figure shows the product structure tree of product A. A D (2) B (2) E (1) C | D (3)…
A: Operations planning and control is a four-level structure consisting of S&OP, MPS, materials…
Q: Haji Ismail Company is going to introduce one of the three new products: keropok, satay, and chips.…
A: Let me state the given data, Product FavorableStable…
Q: For the lincar programming problem below, using simplex method to maximize: Z= x₁ + 2x₂ + 4x₂…
A: Linear Programming Problem is given below:
Q: Problem 3-19 (Algorithmic) Better Products, Inc., manufactures three products on two machines. In a…
A: let me state the given data, CategoryProduct 1Product 2Product 3Profit per unit395118Machine 1 time…
Q: explain how can task allocation strategies be adapted to accommodate the diverse skills and…
A: Task allocation strategies are essential for optimizing team performance and productivity. To…
Q: A company must perform a maintenance project consisting of seven activities. The activities, their…
A: The objective of this question is to identify the activities that have slack in the project using…
Q: what strategies could be employed to ensure that the program's achievements and impacts are…
A: The objective of the question is to identify strategies that can be used to effectively communicate…
Q: Listening to others in class is hard work. Use active listening techniques, apply listening…
A: Focus on the speaker: Avoid distractions and maintain eye contact.Understand the speaker's…
Q: How do processes create wealth?
A: To run any organization, processes act as the backbone, With the help of the processes, resources or…
Q: Discuss, What are the key features and benefits of Failure Mode and Effects Analysis (FMEA) as a…
A: Quality tools are methods for collecting, organizing, and analyzing data, as well as evaluating the…
Q: Please help with (b) and (c) as both answers given were incorrect! Please need correct answers.…
A: The question is regarding the critical path method with triple time estimates given for each…
Q: What are the long-term benefits of establishing value stream mapping as a continuous improvement…
A: Implementing value stream mapping (VSM) as a continuous improvement practice enables organizations…
Q: A major issue in relationships is the question of what is fair, or just; defined as justice. The…
A: The issue is to complete the spaces in the provided explanation about equity in connections…
Q: b) Describe briefly about; i. Inventory, and Inventory cost ii. The purpose to have sales and…
A: inventory: inventory is when goods and services go through the whole process of raw material into…
Q: drafting the research project?
A: Creating an annotated bibliography and an outline can significantly help in achieving the goals of a…
Q: North Platt Machinery Company manufactures a shaft that must fit inside a sleeve. The firm has just…
A: The details related to a shaft that must fit inside a sleeve are given below:The diameter and the…
Q: Midwest University is installing a high-speed intranet system. The following network shows the…
A:
Q: Centerville Bikes and Stuff (CBS) sells motorcycles and accessories. The number of helmets sold by…
A: Naive forecast- Here we use current period’s data as next period’s forecast. The naive forecast will…
Q: What are the key features and benefits of Failure Mode and Effects Analysis (FMEA) as a quality…
A: Failure Mode and Effects Analysis (FMEA) is a systematic method used to identify and mitigate…
Q: How does production scheduling differ in make-to-order versus make-to-stock environments?
A: The process of deciding when things will be made in order to maximize efficiency and minimize…
Q: I need help creating a FINANCIALS section of my marketing plan including: FINANCIALS 4.1…
A: Business is an organization and firm including sales and purchase of goods and services to the…
Q: How does program planning, desighn, and evaluation help to understand the process when planning a…
A: The objective of this question is to understand the importance of program planning, design, and…
Q: Management Firm is a consulting company that specializes in the development of decision support…
A: Time (Weeks)ActivityDescriptionImmediate PredecessorOptimistic (a)Most Probable (m)Pessimistic…
Q: Mueller & Associates is a urban planning firm that is designing a new public park in an Omaha…
A: Find the given details below:
Q: North Platt Machinery Company manufactures a shaft that must fit inside a sleeve. The firm has just…
A: The details related to a shaft that must fit inside a sleeve are given below:The diameter and the…
Q: Discuss the relative merits of internal versus external recruitment. Give an example of a situation…
A: The objective of this question is to understand the advantages of internal and external recruitment…


Trending now
This is a popular solution!

Step by step
Solved in 1 steps with 2 images

- You want to take out a 450,000 loan on a 20-year mortgage with end-of-month payments. The annual rate of interest is 3%. Twenty years from now, you will need to make a 50,000 ending balloon payment. Because you expect your income to increase, you want to structure the loan so at the beginning of each year, your monthly payments increase by 2%. a. Determine the amount of each years monthly payment. You should use a lookup table to look up each years monthly payment and to look up the year based on the month (e.g., month 13 is year 2, etc.). b. Suppose payment each month is to be the same, and there is no balloon payment. Show that the monthly payment you can calculate from your spreadsheet matches the value given by the Excel PMT function PMT(0.03/12,240, 450000,0,0).The eTech Company is a fairly recent entry in the electronic device area. The company competes with Apple. Samsung, and other well-known companies in the manufacturing and sales of personal handheld devices. Although eTech recognizes that it is a niche player and will likely remain so in the foreseeable future, it is trying to increase its current small market share in this huge competitive market. Jim Simons, VP of Production, and Catherine Dolans, VP of Marketing, have been discussing the possible addition of a new product to the companys current (rather limited) product line. The tentative name for this new product is ePlayerX. Jim and Catherine agree that the ePlayerX, which will feature a sleeker design and more memory, is necessary to compete successfully with the big boys, but they are also worried that the ePlayerX could cannibalize sales of their existing productsand that it could even detract from their bottom line. They must eventually decide how much to spend to develop and manufacture the ePlayerX and how aggressively to market it. Depending on these decisions, they must forecast demand for the ePlayerX, as well as sales for their existing products. They also realize that Apple. Samsung, and the other big players are not standing still. These competitors could introduce their own new products, which could have very negative effects on demand for the ePlayerX. The expected timeline for the ePlayerX is that development will take no more than a year to complete and that the product will be introduced in the market a year from now. Jim and Catherine are aware that there are lots of decisions to make and lots of uncertainties involved, but they need to start somewhere. To this end. Jim and Catherine have decided to base their decisions on a planning horizon of four years, including the development year. They realize that the personal handheld device market is very fluid, with updates to existing products occurring almost continuously. However, they believe they can include such considerations into their cost, revenue, and demand estimates, and that a four-year planning horizon makes sense. In addition, they have identified the following problem parameters. (In this first pass, all distinctions are binary: low-end or high-end, small-effect or large-effect, and so on.) In the absence of cannibalization, the sales of existing eTech products are expected to produce year I net revenues of 10 million, and the forecast of the annual increase in net revenues is 2%. The ePIayerX will be developed as either a low-end or a high-end product, with corresponding fixed development costs (1.5 million or 2.5 million), variable manufacturing costs ( 100 or 200). and selling prices (150 or 300). The fixed development cost is incurred now, at the beginning of year I, and the variable cost and selling price are assumed to remain constant throughout the planning horizon. The new product will be marketed either mildly aggressively or very aggressively, with corresponding costs. The costs of a mildly aggressive marketing campaign are 1.5 million in year 1 and 0.5 million annually in years 2 to 4. For a very aggressive campaign, these costs increase to 3.5 million and 1.5 million, respectively. (These marketing costs are not part of the variable cost mentioned in the previous bullet; they are separate.) Depending on whether the ePlayerX is a low-end or high-end produce the level of the ePlayerXs cannibalization rate of existing eTech products will be either low (10%) or high (20%). Each cannibalization rate affects only sales of existing products in years 2 to 4, not year I sales. For example, if the cannibalization rate is 10%, then sales of existing products in each of years 2 to 4 will be 10% below their projected values without cannibalization. A base case forecast of demand for the ePlayerX is that in its first year on the market, year 2, demand will be for 100,000 units, and then demand will increase by 5% annually in years 3 and 4. This base forecast is based on a low-end version of the ePlayerX and mildly aggressive marketing. It will be adjusted for a high-end will product, aggressive marketing, and competitor behavior. The adjustments with no competing product appear in Table 2.3. The adjustments with a competing product appear in Table 2.4. Each adjustment is to demand for the ePlayerX in each of years 2 to 4. For example, if the adjustment is 10%, then demand in each of years 2 to 4 will be 10% lower than it would have been in the base case. Demand and units sold are the samethat is, eTech will produce exactly what its customers demand so that no inventory or backorders will occur. Table 2.3 Demand Adjustments When No Competing Product Is Introduced Table 2.4 Demand Adjustments When a Competing Product Is Introduced Because Jim and Catherine are approaching the day when they will be sharing their plans with other company executives, they have asked you to prepare an Excel spreadsheet model that will answer the many what-if questions they expect to be asked. Specifically, they have asked you to do the following: You should enter all of the given data in an inputs section with clear labeling and appropriate number formatting. If you believe that any explanations are required, you can enter them in text boxes or cell comments. In this section and in the rest of the model, all monetary values (other than the variable cost and the selling price) should be expressed in millions of dollars, and all demands for the ePlayerX should be expressed in thousands of units. You should have a scenario section that contains a 0/1 variable for each of the binary options discussed here. For example, one of these should be 0 if the low-end product is chosen and it should be 1 if the high-end product is chosen. You should have a parameters section that contains the values of the various parameters listed in the case, depending on the values of the 0/1 variables in the previous bullet For example, the fixed development cost will be 1.5 million or 2.5 million depending on whether the 0/1 variable in the previous bullet is 0 or 1, and this can be calculated with a simple IF formula. You can decide how to implement the IF logic for the various parameters. You should have a cash flows section that calculates the annual cash flows for the four-year period. These cash flows include the net revenues from existing products, the marketing costs for ePlayerX, and the net revenues for sales of ePlayerX (To calculate these latter values, it will help to have a row for annual units sold of ePlayerX.) The cash flows should also include depreciation on the fixed development cost, calculated on a straight-line four-year basis (that is. 25% of the cost in each of the four years). Then, these annual revenues/costs should be summed for each year to get net cash flow before taxes, taxes should be calculated using a 32% tax rate, and taxes should be subtracted and depreciation should be added back in to get net cash flows after taxes. (The point is that depreciation is first subtracted, because it is not taxed, but then it is added back in after taxes have been calculated.) You should calculate the company's NPV for the four-year horizon using a discount rate of 10%. You can assume that the fixed development cost is incurred now. so that it is not discounted, and that all other costs and revenues are incurred at the ends of the respective years. You should accompany all of this with a line chart with three series: annual net revenues from existing products; annual marketing costs for ePlayerX; and annual net revenues from sales of ePlayerX. Once all of this is completed. Jim and Catherine will have a powerful tool for presentation purposes. By adjusting the 0/1 scenario variables, their audience will be able to see immediately, both numerically and graphically, the financial consequences of various scenarios.A company manufacturers a product in the United States and sells it in England. The unit cost of manufacturing is 50. The current exchange rate (dollars per pound) is 1.221. The demand function, which indicates how many units the company can sell in England as a function of price (in pounds) is of the power type, with constant 27556759 and exponent 2.4. a. Develop a model for the companys profit (in dollars) as a function of the price it charges (in pounds). Then use a data table to find the profit-maximizing price to the nearest pound. b. If the exchange rate varies from its current value, does the profit-maximizing price increase or decrease? Does the maximum profit increase or decrease?
- Another way to derive a demand function is to break the market into segments and identify a low price, a medium price, and a high price. For each of these prices and market segments, we ask company experts to estimate product demand. Then we use Excels trend curve fitting capabilities to fit a quadratic function that represents that segments demand function. Finally, we add the segment demand curves to derive an aggregate demand curve. Try this procedure for pricing a candy bar. Assume the candy bar costs 0.55 to produce. The company plans to charge between 1.10 and 1.50 for this candy bar. Its marketing department estimates the demands shown in the file P07_47.xlsx (in thousands) in the three regions of the country where the candy bar will be sold. What is the profit-maximizing price, assuming that the same price will be charged in all three regions?The method for rating teams in Example 7.8 is based on actual and predicted point spreads. This method can be biased if some teams run up the score in a few games. An alternative possibility is to base the ratings only on wins and losses. For each game, you observe whether the home team wins. Then from the proposed ratings, you predict whether the home team will win. (You predict the home team will win if the home team advantage plus the home teams rating is greater than the visitor teams rating.) You want the ratings such that the number of predictions that match the actual outcomes is maximized. Try modeling this. Do you run into difficulties? (Remember that Solver doesnt like IF functions.) EXAMPLE 7.8 RATING NFL TEAMS9 We obtained the results of the 256 regular-season NFL games from the 2015 season (the 2016 season was still ongoing as we wrote this) and entered the data into a spreadsheet, shown at the bottom of Figure 7.38. See the file NFL Ratings Finished.xlsx. (Some of these results are hidden in Figure 7.38 to conserve space.) The teams are indexed 1 to 32, as shown at the top of the sheet. For example, team 1 is Arizona, team 2 is Atlanta, and so on. The first game entered (row 6) is team 19 New England versus team 25 Pittsburgh, played at New England. New England won the game by a score of 28 to 21, and the point spread (home team score minus visitor team score) is calculated in column J. A positive point spread in column J means that the home team won; a negative point spread indicates that the visiting team won. The goal is to determine a set of ratings for the 32 NFL teams that most accurately predicts the actual outcomes of the games played.Suppose that GLC earns a 2000 profit each time a person buys a car. We want to determine how the expected profit earned from a customer depends on the quality of GLCs cars. We assume a typical customer will purchase 10 cars during her lifetime. She will purchase a car now (year 1) and then purchase a car every five yearsduring year 6, year 11, and so on. For simplicity, we assume that Hundo is GLCs only competitor. We also assume that if the consumer is satisfied with the car she purchases, she will buy her next car from the same company, but if she is not satisfied, she will buy her next car from the other company. Hundo produces cars that satisfy 80% of its customers. Currently, GLC produces cars that also satisfy 80% of its customers. Consider a customer whose first car is a GLC car. If profits are discounted at 10% annually, use simulation to estimate the value of this customer to GLC. Also estimate the value of a customer to GLC if it can raise its customer satisfaction rating to 85%, to 90%, or to 95%. You can interpret the satisfaction value as the probability that a customer will not switch companies.