The following Venn diagram shows the probabilities associated with events in possibility space S. L 0.21 (0.12 0.33 0.34
The following Venn diagram shows the probabilities associated with events in possibility space S. L 0.21 (0.12 0.33 0.34

A First Course in Probability (10th Edition)
10th Edition
ISBN:9780134753119
Author:Sheldon Ross
Publisher:Sheldon Ross
Chapter1: Combinatorial Analysis
Section: Chapter Questions
Problem 1.1P: a. How many different 7-place license plates are possible if the first 2 places are for letters and...

Related questions
Question
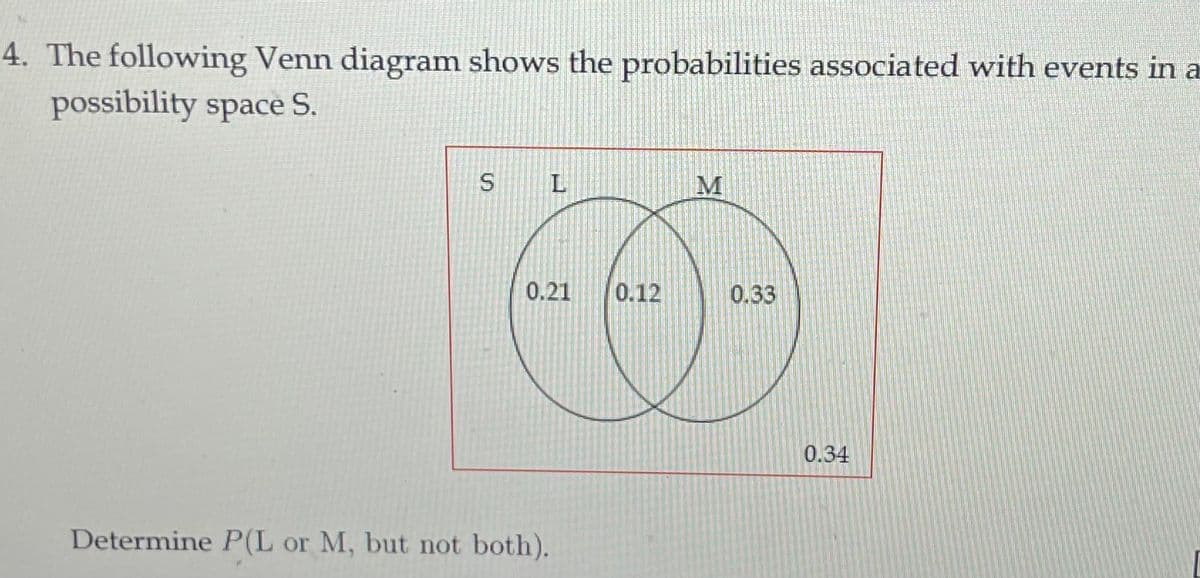
Transcribed Image Text:4. The following Venn diagram shows the probabilities associated with events in a
possibility space S.
M
0.21
0.12
0.33
0.34
Determine P(L or M, but not both).
Expert Solution
This question has been solved!
Explore an expertly crafted, step-by-step solution for a thorough understanding of key concepts.

Step by step
Solved in 2 steps with 1 images

Recommended textbooks for you
A First Course in Probability (10th Edition)
Probability
ISBN:
9780134753119
Author:
Sheldon Ross
Publisher:
PEARSON

A First Course in Probability (10th Edition)
Probability
ISBN:
9780134753119
Author:
Sheldon Ross
Publisher:
PEARSON