The following wave heights were recorded over 24 hour period; Table 1: Recorded wave heights over 24 hour period. H(m) 0-1 1-2 2-3 3-4 4-5 5-6 1220 2340 3350 3210 1900 980 Plot the wave height histogram and define probability distribution function along with Rayleigh. Find the probability that waves have a height between 3.00m and 5.00m.
The following wave heights were recorded over 24 hour period; Table 1: Recorded wave heights over 24 hour period. H(m) 0-1 1-2 2-3 3-4 4-5 5-6 1220 2340 3350 3210 1900 980 Plot the wave height histogram and define probability distribution function along with Rayleigh. Find the probability that waves have a height between 3.00m and 5.00m.

A First Course in Probability (10th Edition)
10th Edition
ISBN:9780134753119
Author:Sheldon Ross
Publisher:Sheldon Ross
Chapter1: Combinatorial Analysis
Section: Chapter Questions
Problem 1.1P: a. How many different 7-place license plates are possible if the first 2 places are for letters and...

Related questions
Question
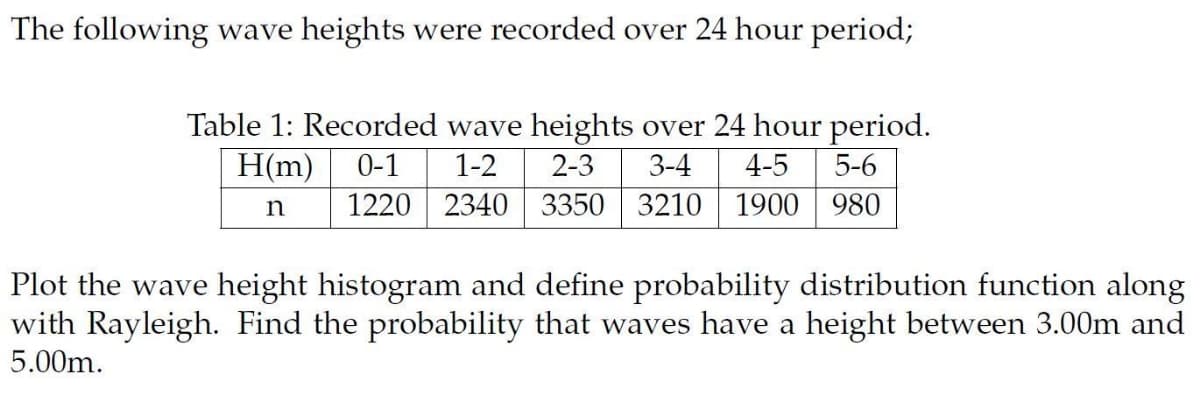
Transcribed Image Text:The following wave heights were recorded over 24 hour period;
Table 1: Recorded wave heights over 24 hour period.
H(m)
0-1
1-2
2-3
3-4
4-5
5-6
1220 2340 3350 3210 1900 980
Plot the wave height histogram and define probability distribution function along
with Rayleigh. Find the probability that waves have a height between 3.00m and
5.00m.
Expert Solution
This question has been solved!
Explore an expertly crafted, step-by-step solution for a thorough understanding of key concepts.

This is a popular solution!

Trending now
This is a popular solution!

Step by step
Solved in 2 steps with 2 images

Recommended textbooks for you
A First Course in Probability (10th Edition)
Probability
ISBN:
9780134753119
Author:
Sheldon Ross
Publisher:
PEARSON

A First Course in Probability (10th Edition)
Probability
ISBN:
9780134753119
Author:
Sheldon Ross
Publisher:
PEARSON