The function g(x) = 1.8√√x +36.1 models the median height, g(x), in inches, of children who are x months of age. The graph of g is shown. 60- 50- 40- The model describes the actual height 30- 20-1 a. Describe how the graph can be obtained using transformations of the square root function f(x)=√√x. O A. Stretch f(x) horizontally by a factor of 1.8. Shift f(x) left by 36.1 units. OB. Stretch f(x) vertically by a factor of 1.8. Shift f(x) up by 36.1 units. O C. Shrink f(x) horizontally by a factor of 1.8. Shift f(x) down by 36.1 units. O D. Stretch f(x) vertically by a factor of 1.8. Shift f(x) right by 36.1 units. O A. very well. B. poorly. 10- 0- 0 102030405060 b. According to the model, what is the median height of children who are 48 months, or 4 years, old? Use a calculator to find the median height. The median height is inches. (Round to the nearest tenth of an inch.) The actual median height for children at 48 months is 49 inches. How well does the model describe the actual height? c. Use the model to find the average rate of change, in inches per month, between birth and 8 months. The average rate of change is inches per month. (Round to the nearest tenth.)
The function g(x) = 1.8√√x +36.1 models the median height, g(x), in inches, of children who are x months of age. The graph of g is shown. 60- 50- 40- The model describes the actual height 30- 20-1 a. Describe how the graph can be obtained using transformations of the square root function f(x)=√√x. O A. Stretch f(x) horizontally by a factor of 1.8. Shift f(x) left by 36.1 units. OB. Stretch f(x) vertically by a factor of 1.8. Shift f(x) up by 36.1 units. O C. Shrink f(x) horizontally by a factor of 1.8. Shift f(x) down by 36.1 units. O D. Stretch f(x) vertically by a factor of 1.8. Shift f(x) right by 36.1 units. O A. very well. B. poorly. 10- 0- 0 102030405060 b. According to the model, what is the median height of children who are 48 months, or 4 years, old? Use a calculator to find the median height. The median height is inches. (Round to the nearest tenth of an inch.) The actual median height for children at 48 months is 49 inches. How well does the model describe the actual height? c. Use the model to find the average rate of change, in inches per month, between birth and 8 months. The average rate of change is inches per month. (Round to the nearest tenth.)

Glencoe Algebra 1, Student Edition, 9780079039897, 0079039898, 2018
18th Edition
ISBN:9780079039897
Author:Carter
Publisher:Carter
Chapter9: Quadratic Functions And Equations
Section9.2: Transformations Of Quadratic Functions
Problem 50PFA

Related questions
Question
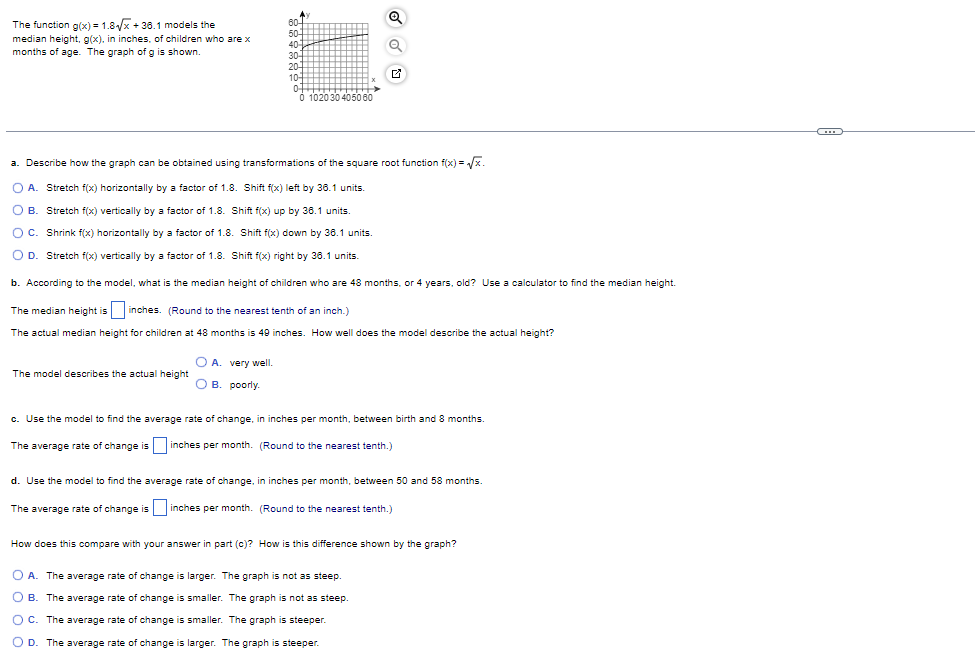
Transcribed Image Text:The function g(x) = 1.8√x+36.1 models the
median height, g(x), in inches, of children who are x
months of age. The graph of g is shown.
The model describes the actual height
60
50-
40-
a. Describe how the graph can be obtained using transformations of the square root function f(x)=√√x.
O A. Stretch f(x) horizontally by a factor of 1.8. Shift f(x) left by 36.1 units.
O B. Stretch f(x) vertically by a factor of 1.8. Shift f(x) up by 36.1 units.
O C. Shrink f(x) horizontally by a factor of 1.8. Shift f(x) down by 36.1 units.
O D. Stretch f(x) vertically by a factor of 1.8. Shift f(x) right by 36.1 units.
b. According to the model, what is the median height of children who are 48 months, or 4 years, old? Use a calculator to find the median height.
The median height is inches. (Round to the nearest tenth of an inch.)
The actual median height for children at 48 months is 49 inches. How well does the model describe the actual height?
OA. very well.
OB. poorly.
30-
20-
10-
0-
******
0 102030405060
c. Use the model to find the average rate of change, in inches per month, between birth and 8 months.
The average rate of change is inches per month. (Round to the nearest tenth.)
d. Use the model to find the average rate of change, in inches per month, between 50 and 58 months.
The average rate of change is inches per month. (Round to the nearest tenth.)
How does this compare with your answer in part (c)? How is this difference shown by the graph?
OA. The average rate of change is larger. The graph is not as steep
OB.
B. The average rate of change is smaller. The graph is not as steep.
OC. The average rate of change is smaller. The graph is steeper.
O D. The average rate of change is larger. The graph is steeper.
Expert Solution
This question has been solved!
Explore an expertly crafted, step-by-step solution for a thorough understanding of key concepts.

Step by step
Solved in 3 steps with 3 images

Recommended textbooks for you
Glencoe Algebra 1, Student Edition, 9780079039897…
Algebra
ISBN:
9780079039897
Author:
Carter
Publisher:
McGraw Hill

College Algebra
Algebra
ISBN:
9781305115545
Author:
James Stewart, Lothar Redlin, Saleem Watson
Publisher:
Cengage Learning

Algebra & Trigonometry with Analytic Geometry
Algebra
ISBN:
9781133382119
Author:
Swokowski
Publisher:
Cengage
Glencoe Algebra 1, Student Edition, 9780079039897…
Algebra
ISBN:
9780079039897
Author:
Carter
Publisher:
McGraw Hill
College Algebra
Algebra
ISBN:
9781305115545
Author:
James Stewart, Lothar Redlin, Saleem Watson
Publisher:
Cengage Learning
Algebra & Trigonometry with Analytic Geometry
Algebra
ISBN:
9781133382119
Author:
Swokowski
Publisher:
Cengage


Big Ideas Math A Bridge To Success Algebra 1: Stu…
Algebra
ISBN:
9781680331141
Author:
HOUGHTON MIFFLIN HARCOURT
Publisher:
Houghton Mifflin Harcourt
