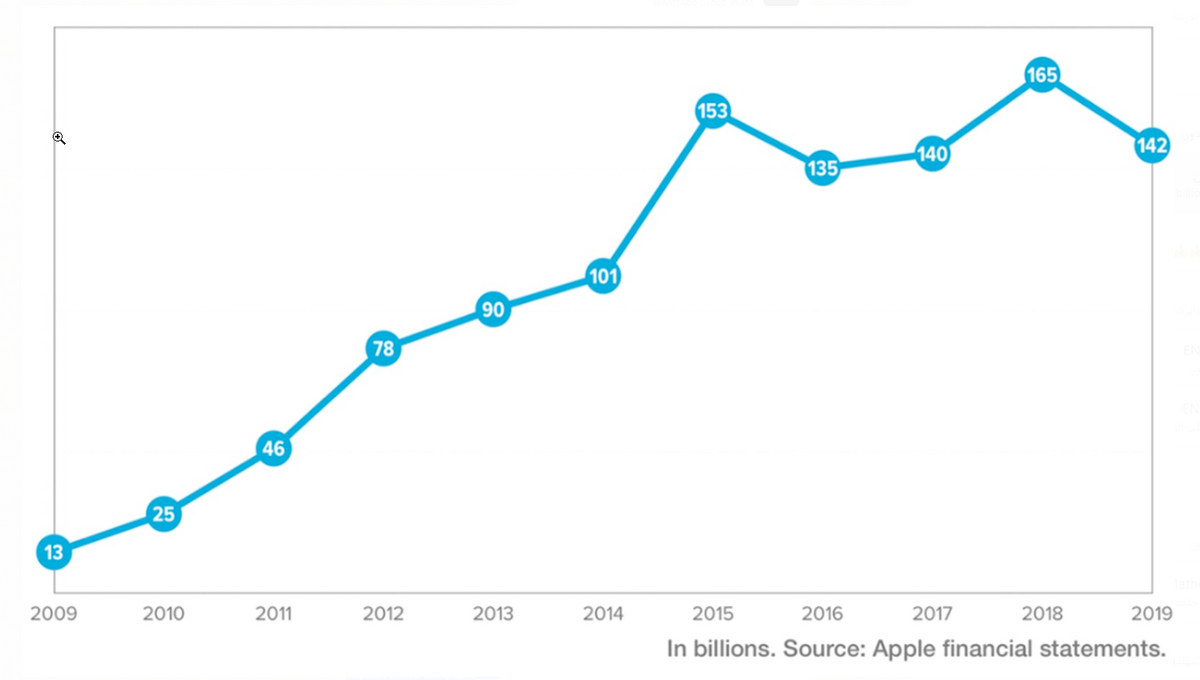
The graph below shows the revenue of Apple in billions between the years 2009 and 2019. Add a caption and describe the graph below (120 – 150 words). Make sure to write the caption appropriately. Caption above the graph:_____

Q: How did the Mongols build the greatest land empire ever seen in history? (be sure to discuss specifi...
A: Mongol emperor Genghis Khan gain power from soft beginnings to develop the largest empire in history...
Q: What were the best and worst things about life on the frontier? How was the frontier experience for ...
A: The Westward Expansion was one of the important events in U.S. history. It began in 1803 with the Lo...
Q: 1. What were some reasons that the United States began an expansionist course in foreign policy in t...
A: The term "foreign policy" is used to refer to the relationships and interaction of a nation with oth...
Q: Which is true about the source of Document C? It is a primary source It is a secondary source O It w...
A: Harriet Hanson Robinson was the daughter of a carpenter and store owner. Her father dies when she wa...
Q: Discuss about contract of indenture
A: In history contracts, promises were done verbally. People each other's words for the contract and ag...
Q: Explain Japanese Reunification and Economic Growth
A: During the 17 century, most of Asia was under the colonial rule of European powers. This led to the ...
Q: Discuss Fascist Party
A: The National Fascist Party was an Italian party, made by Mussolini because of the political discours...
Q: Case name: Baker v. Carr (1962) Does the decision made in your case still stand or has it been chang...
A: Charles Baker, a resident of Tennessee filed a suit in federal court in against Joe Carr, the Secret...
Q: . Explain why Newfoundland and Prince Edward Island say no to Confederation
A: The Confederation movement in Canada aimed to unite the different colonies to built one strong natio...
Q: How does Plato's Academy or the Greek Philosophers schooling compare to the education or university ...
A: Plato was one of the most famous Greek philosophers. He started the academy in the late fourth centu...
Q: Macdonald at Quebec argues that a Legislative Union instead of a Federal Union would be much better ...
A: The Quebec Conference was held from October 10-24, 1864 to have discussion On Canadian Confederation...
Q: Define Chinese Family-PlanningCampaign
A: China became a communist state in 1950. The present population is 1.39 billion. The population growt...
Q: Describe each of the following predictors and explain how each contributes to the likelihood of voti...
A: Education: Education is an important predictor but it varies with geographies, level of government, ...
Q: How would it feel to be in the 3rd crusades
A: The third crusades that took place during 1189-1192 was an attempt-by the three European-monarchs of...
Q: In what respects did Hinton R. Helper help to cause the Civil War? In what respects did the “Cotton ...
A: Despite his less education, Helper came to attention in 1857 with his work The Impending Crisis of t...
Q: Write about Colonial Expansion and Council
A: Colonialism started during the age of renaissance in Europe in the fifteenth century. The European n...
Q: 3. What was the purpose of the dog tags?
A: The historical situation reflects upon the fundamental status of ideologies prescribed by various na...
Q: Explain Laissez Faire and Its Critics
A: The laissez-faire is an economic-system where the transition within the private groups is free-from ...
Q: D Question 17 Tito O leader of Yugoslavia O played third base for the Giants O No answer text provid...
A: All these questions are related to history.
Q: Which temple has beautiful complex of terraces, ramps and colonnades
A: Egyptian kings and pharaohs commissioned the construction of magnificent building projects in honor ...
Q: Define Suez Canal
A: The modern canal system has mainly been a product of the 18th century and early 19th century. This t...
Q: respond to the following paragraph below please by adding/responding to the info. I thought that you...
A: Human life is greatly impacted by religion. Each religion is based on certain principles and beliefs...
Q: What is the difference in Rizal's Political administration during the spanish time to today’s admini...
A: Rizal's political administration took place in Philippines.
Q: 6. What was the goal of Nazi propaganda that targeted Jews?
A: World War 2 brought many faces of evil and its horrors to light. It shook humanity to the core, so m...
Q: Discuss how after 1991, Ethiopia’s political-economic environment has changed. What hampered economi...
A: Ethiopia also called the Federal Republic of Ethiopia is a country in Africa. This country has exper...
Q: Explain Woodrow Wilson’s Fourteen Points
A: War has been a permanent blot on humanity through the course of nature. But men of virtue have tried...
Q: Why would the Austro-Empire hate the Russians for supporting Serbian
A: The Assassination of Archduke Franz directed Austria-Hungary to announce war on Serbia in the July C...
Q: Define Tupac Amaru II
A: Tupac Amaru II, real name was José Gabriel Condorcanqui, Peruvian Indian revolutionary (born 1740–42...
Q: Go to the British North America Act. List 10 areas that the federal government has responsibility fo...
A: British North America Act was the act of parliament of the United Kingdom in 1867.
Q: Define Hipólito Irigoyen
A: Latin America had a revolutionary history as far as the establishment of democratic institution is c...
Q: Explain Southwestern Desert Cultures
A: Southwestern culture is very different from plain culture. The southwest dessert is very dry. Most o...
Q: Explain Safavid Society and Religion
A: The Safavids ruled over modern-day Iran as a dynastic family. They ruled Iran for 1501 to 1736, maki...
Q: Based on the attached images, how does Johnson explain the philosophy behind Presidential Reconstruc...
A: The Presidential Reconstruction was formed in 1865. It was a reconstruction plan formed after Abraha...
Q: respond to the following paragraph below please by adding/responding to the info. I thought that you...
A: Religions existing in the world have their own beliefs and faiths. Some common elements are seen thr...
Q: Did Lincoln free all African Americans
A: The Emancipation Proclamation was one of the most significant and historical declarations in the wor...
Q: In what ways did the U.S.–British confrontation over the Oregon country, which was resolved peaceful...
A: The Oregon boundary dispute was a territorial dispute over the political division of the Pacific Nor...
Q: Which country has the lowest rate of AIDS cases?
A: AIDS is caused due to a virus that weakens the immune system. It stands for acquired immunodeficienc...
Q: Explain Revolutions of 1848
A: The Revolutions of 1848, referred to in certain nations as the Springtime of the Peoples or the Spri...
Q: Regarding latin america at the rnd of Cold War, Neoliberalism, Globalization 3.0 and 21stCentury Tra...
A: The cold war ultimately declined by the year 1991. The world revamped post-cold war.
Q: once the schlieffen plan failed the germans were surrounded and stuck fighting a two front war. why ...
A: The Schlieffen plan was created by General Count Alfred Von Schlieffen in December 1905. The plan wa...
Q: Discuss The Spread of Buddhism
A: The ‘spread of Buddhism’ marks the religious movement through Asia. Emperor Ashoka converted to Budd...
Q: What measures did Alexander use to expand Greek cultural influence?
A: Alexander the Great's legacy extends far and wide. First, his father conquered Greek cities, and Ale...
Q: Define Bornu
A: A region and former Muslim kingdom of western Africa occupying a vast plain in present-day northeast...
Q: Discuss The Road to War, 1933–1939
A: Nazi's domestic and foreign policies contributed the fire of the World War II. It encouraged Hitler ...
Q: Did the Reconstruction policies obtain their goals?
A: The Reconstruction era was the duration that started after the American Civil War from the year 1865...
Q: Explain The Russian Empire
A: The Russian Empire was a recorded realm that reached out across Eurasia and North America from 1721,...
Q: Which government under Chiang Kai-shek foughtboth the Japanese and the Communists led by Mao Zedong...
A: The Chinese warfare was a warfare in China fought betwixt the Kuomintang (KMT)-led govt. of the Repu...
Q: 1. Summarizing What are two problems that critics say come from illegal immigration? 2. Analyzing Wh...
A: The early arrival of immigrants to the United States was attempted as a passive trickle at the start...
Q: How did Mesopotamian civilization emerge, and what technologies promoted itsadvancement?
A: Mesopotamia is a historic region of western-Asia and is located within the Tigris-and Euphrates rive...
Q: Everything you need to know about the Great Depression.
A: The Great Depression was the nation's worst economic depression. It started in 1929 and lasted throu...
The graph below shows the revenue of Apple in billions between the years 2009 and 2019.
Add a caption and describe the graph below (120 – 150 words). Make sure to write the
caption appropriately.
Caption above the graph:_____

Step by step
Solved in 2 steps
