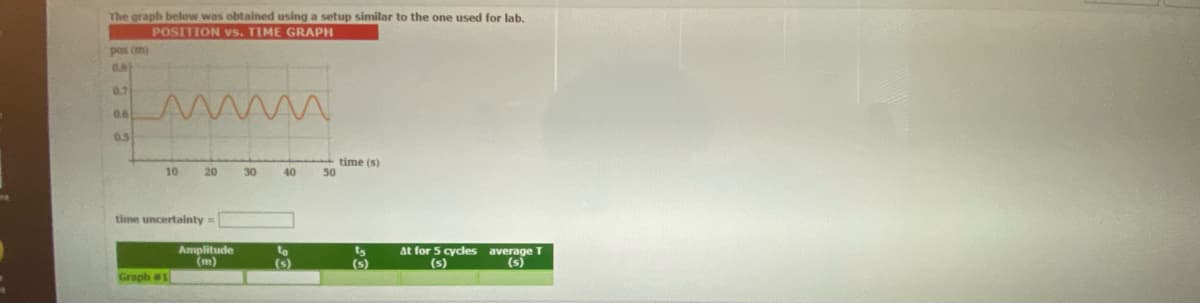
The graph below was obtained using a setup similar to the one used for lab. POSITION vs. TIME GRAPH pas (m) 0.81 0.7 0.6 0.5 time (s) 10 20 30 40 time uncertainty = ts average T (s) Graph #1 Amplitude (m) to (s) 50 At for 5 cycles (s)

Q: 4.) Prove that I (8,1), I (7,4) and I (9,7) are degenerate assuming that the length in the Lx and Ly…
A: The energy eigenvalues for particle two-dimensional quantum box are given by
Q: In T.G. a deflection of 45° is obtained when a current of 173 mA is passed through it. The…
A: Given data : I1 = 173 mA when theta1 = 45° To find : Find I2 when theta2 = 30°
Q: Within the green dashed circle shown below, the magnetic field changes with time according to B =…
A: Solution attached in the photo
Q: A sample of radioactive isotope is found to have an activity of 110 Bq imediately after it is pulled…
A: From given initial activity and final activity we first find the decay constant and then from…
Q: 5.68 •• CP In Fig. P5.68 Figure P5.68 m1 = 20.0 kg and 53.1°. The coefficient of a = kinetic…
A: m1 = 20.0 kg α = 53.1o Coefficient of kinetic friction between incline and block mass m1 is μk =…
Q: A coil with a magnetic moment of 1.50 A . m² is oriented initially with its magnetic moment…
A: Solution:-Given thatMagnetic moment (μ)=1.5 A.m2Magnetic field (B)=0.82 TInitially, magnetic moment…
Q: The electric field everywhere on the surface of a thin, spherical shell of radius 0.750 m is of…
A: Solution:-Given thatElectric field on surface of a thin, spherical shell (E)=890 N/CRadius of…
Q: Diffraction: Here we compare the resolution of two famous telescopes. III. Calculate the diffraction…
A:
Q: A phonograph record centered at the origin carries a uniform static charge density σ=4σ0, if it…
A: Given that the phonograph record carries a uniform charge density of σ=4σ0 and its angular speed is…
Q: Explain the light emission by meteorite?
A: Asteroids are rocky bodies that are mostly found in the asteroid belt that exists between Mars and…
Q: A uniform horizontal beam, connected to the rigid wall with a pin joint, has a span of 10.0 m and a…
A: Solution:-Given thatSpan (L)=10 mmass of beam (m)=25 kgmass of crate (M)=48 kg
Q: A vertical electric field of magnitude 2.00 × 10⁴ N/C exists above the Earth's surface on a day when…
A: Electric flux is defined as the number of electric field lines that are passing through a given…
Q: A point charge of 6 nC is located at origin in free space. Find Vp if point P is located at P (0.2,…
A: Charge q = 6 nC = 6 × 10- 9 C Point P(0.2, - 0.4, 0.4) V = 0 at ∞
Q: A light ray of wavelength 589 nm is incident at an angle on the top surface of a block of…
A:
Q: Given the mass of an electron is 9x10-31kg, confined to infinite well of length (L) and has energy…
A: Given: Planck's constant,h=6.626×10⁻³⁴JsMass of…
Q: A coil with magnetic moment 1.44 A m² is oriented initially with its magnetic moment antiparallel to…
A:
Q: Question: Calculate the initial (from rest) acceleration of a proto electric field (such as created…
A:
Q: Pluto was first discovered in 1930. It was determined to be located about 39.48 times as far away…
A: Given Data : Rp = 39.48 Re To find : Time taken by pluto to orbit the sun
Q: Now consider 0e, the angle at which the blue refracted ray hits the bottom surface of the diamond.…
A: Given data : Refractive index nblue = 2.450 nred = 2.410 nair = 1.000 To find : Find critical…
Q: wwwwwww -12"- A UB VA B 12"- 5"
A:
Q: Use the cylinder's surface area and it is intuitive to say that the electric flux is zero everywhere…
A:
Q: In T.G. a deflection of 45° is obtained when a current of 173 mA is passed through it. The…
A: Let us find the current when deflection from 45° with 173 mA current changes to 30° in a T.G.
Q: Calculate the number of electrons in a small, electrically neutral silver pin that has a mass of…
A: The number of atoms can be calculated from the product of the number of moles n and the Avogadro's…
Q: Twin A makes a round trip at 0.6c to a star 18 light-years away, while twin B stays on the earth.…
A:
Q: Calculate the power output needed for a 950-kg car to climb a 2.00° slope at a constant 30.0 m/s…
A: Here motion of car is opposed by 1.friction force 2. Wind resistance 3. Gravitational force. In…
Q: A galvanometer has a resistance of 16 Q2. It shows full scale deflection, when a current of 20 mA is…
A:
Q: A finite-length wire with current I =5 A is positioned along the z-axis and is centered at the…
A:
Q: A sphere of radius R=15cm carries a magnetization M = kr¹ where k-2 is a constant, r is the distance…
A: Faraday's law relates the curl of an electric field to the change in the magnetic field. Stoke's…
Q: Part A: Determine the magnitude of the velocity of point P located on its rim after the wheel has…
A:
Q: Consider a magnetic system with n independent molecules per unit volume, each of which has four…
A: {art (c): Given that the magnetic system has n independent molecules and each has four energy states…
Q: 14. A cancer patient received a gamma-ray dose of 0.1 Gy and a proton dose of 200 mGy. What was the…
A: Solution: The equivalent dose of the gamma-ray dose and the proton dose is given by the following…
Q: (d) Explain what is meant by the following terms: O Kinetic Energy E) () Potential Energy (PE) ()…
A: The ability to work is defined as energy. The capacity of a body to accomplish work can be…
Q: The unit sphere 8 ha e' is a regular polyg
A: Consider square ABCD, and O be the center of the square on the unit sphere. Lets take OAB and the…
Q: Based on the figure below, explain which statement(s) best explain(s) the method to obtain electric…
A: The necessary criteria is that the Gaussian surface must be a closed surface and should be…
Q: A measure of how much flux (lumens) is emitted within a small conical angle in a particular…
A: The strength of visible light generated by a light source or light fitting is measured in luminous…
Q: A 64.6 g ball moves at 38 m/s. If its speed is measured to an accuracy of 0.07%, what is the minimum…
A:
Q: A 2.00X10³kg car rounds a circular turn of radius20,0 m. If the road is flat and the coefficient of…
A:
Q: An undamped spring-mass system with mass m = 2 and a spring constant k = 8 is suddenly set in motion…
A: The position of the mass as a function of time. Given, Force, F=5cos3tmass(m)=2and spring constant…
Q: FA = 50.0 N 42.0 N Fo 30° FA 30 FE em of forces. 20° FB = 68.0 N Fc = FD = 21.0 N FE = 80.0 N FB Fo…
A: FA=50 N component of FA in y direction = FA cos 30° (+y direction ) = 43.33 N component of FA in x…
Q: A galvanometer has a resistance of 16 2. It shows full scale deflection, when a current of 20 mA is…
A:
Q: • Planck's constant 6.6262 x 10 Js • speed of light= 3.00 x 10' ms • Avogadro's number 6.022 x 10"…
A:
Q: VS. FIRE graph below to answer the following questions. Let east be the positive direction. Express…
A: Given data : The momentum vs time curve is given To find : Time period when object is not moving…
Q: About how many joules of heat energy would increase your body temperature by 0.018 degrees Celsius?…
A: a) Given temperature change (increased) is ∆T=0.018oC The average specific heat of the human body is…
Q: The charges and coordinates of two charged particles held fixed in an xy plane are q₁ = 2.22 μC, x₁…
A: Given: Charge 1,q1=2.22μC=2.22×10⁻⁶CDistance of charge 1 in x-direction,x1=4.88cm=4.88×10⁻²mDistance…
Q: 1. Calculate the Hall effect when a probe is placed on an artery, applying a 0.800-T magnetic field…
A: Since we answer up to one question, we will answer the first question only. Please resubmit the…
Q: 2. The cell membrane is to be considered a thin layer enveloping a cell. In the static case, the…
A: I) The cell is considered to be cavity. The electric field inside cavity is 0, since it is not…
Q: A charged capacitor (C=1μF) is connected in a single loop circuit with an inductor (L = 3mH). Part A…
A:
Q: A three-blade wind turbine, which spins perpendicularly to the ground, is set on a pole that is 38 m…
A:


Trending now
This is a popular solution!

Step by step
Solved in 2 steps with 1 images
