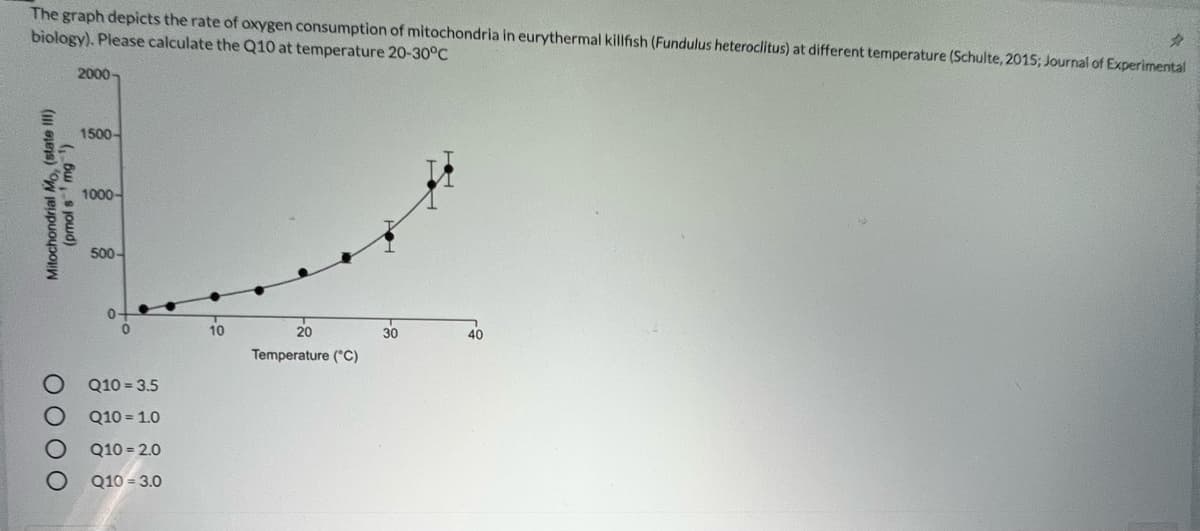
The graph depicts the rate of oxygen consumption of mitochondria in eurythermal killifish (Fundulus heteroclitus) at different temperature (Schulte, 2015; Journal of Experimer biology). Please calculate the Q10 at temperature 20-30°C 2000 1500- 1000- 500- 10 40 Temperature (*C) Q10 = 3.5 Q10 = 1.0 Q10 = 2.0 Q10 = 3.0 O O O 0


Q: Topoisomerases can cut phosphodiester bonds and the DNA ligases will have to seal the nicks whenever...
A: DNA ligases are enzymes that catalyze formation of a phosphodiester bond at a single-strand break in...
Q: _4] Xylose gives a positive result with Molisch's, Seliwanoff's, & Bial's-Orcinol tests. 5] Aniline-...
A: Carbohydrates are widely distributed in plants and animals and they have important structural and me...
Q: Briefly describe the action of glucagons on free fatty acids
A: Hormones are the messengers that transmit signals from one to another. They bind to another cell cal...
Q: If the % transmittance greater than 90%, then which of the following is true The solution is h...
A: The relationship between transmittance and absorbance is logarithmic. If a solution has higher trans...
Q: Concerning the process of the aerobic fate of glucose oxidation, which of the following statements i...
A: Answer False sentence is The spontaneous movement of protons is coupled to the unfavourable movement...
Q: The metabolism of alcohol pathway is showed in the figure characterized by biotransformation of: (F...
A: Metabolism- The primary enzyme involved in the metabolism of alcohol is ADH( Alcohol dehydrogenase)...
Q: Glycoproteins contain carbohydrate units covalently bonded to a polypeptide chain True False
A: Glycoproteins on the cell surfaces are important for communication between cells and for maintaining...
Q: OH HỌ HO OH но OH но но- но но ÓH This sugar is non-reducing O True O False
A: Sugars are carbohydrates, they are monosaccharides, disaccharides, tri-saccharrides, oligosaccharide...
Q: 3. Paramecia are unicellular organisms that have contractile vacuoles to remove (pump) excess intrac...
A: Osmoregulation is the process by which all the cells can establish their water and salt balance such...
Q: Describe the structure of amino acids, and explain how their sequence in proteins affects the protei...
A: Amino acids are building blocks of proteins and consist of carboxyl group, amino group, side chain g...
Q: a. Draw the structures of tyrosine as different pH values. Please refer to the lecture notes for the...
A: Amino acids are monomers of protein they are linked with each other by forming peptide bon...
Q: Thioester play an important role in glycolysis and the TCA cycle. Which reactions in glycolysis and ...
A: Thioesters usually come from/get interconverted with the acyl phosphate species, or acyl adenylate
Q: Draw the products that would be produced from phospholipase C cleavage of a glycerophospholipid with...
A: The glycerol is attached to two linoleic fatty acids at C2 and C3 carbons. The C1 carbon is attached...
Q: Why do steroid hormones not require signal transduction and second messengers to exert their actions...
A: Steroid hormones:- It is a group of hormones , belong to the class of chemical compounds known as st...
Q: QUESTION 6 Beta sheets shown in the figure below are: R N. H R R R H H H. 0. R H 0. R RI Ounn
A:
Q: true or false 1. Catabolism is the breakdown of substances in a biological system 2. Aromatic hydr...
A: 1. Catabolism is the breakdown of substances in a biological system. Answer: True Explanation: Cat...
Q: Microbial products can be classified as three major categories. With the use of sketch, briefly expl...
A: Microorganism growth is a very complex and coordinated process that culminates in an increase in cel...
Q: Seatwork CH2 CH Identify the type of bond(s) that stabilizes the protein structures. H,C H,C CH CH H...
A: A peptide bond is a chemical bond between two amino acid residues in which the carboxyl group of one...
Q: why is the pathway for biosynthesis of a biomolecule at least partially different than the pathway f...
A: Biomolecules or biological molecules are the molecules that are present in organisms. The major type...
Q: Number of electrons generated for complex Il in oxidation of 2 acetyl CoA via the TCA Cycle.
A: The TCA cycle is also known as the tricarboxylic acid cycle. The TCA cycle oxidizes the acetyl Co-A ...
Q: . What are the tissue sources of Alkaline phosphatase? 2. What are Regan and Nagao isoenzymes? 3....
A: Alkaline phosphatase ALP is a ubiquitous membrane bound glycoprotein present in many mammalian tissu...
Q: The DNA helix is stabilized by I. hydrogen bonds between primary amine groups and keto groups II. ...
A: DNA is a double-stranded nucleic acid present within the nucleus of the cell. The double-helical str...
Q: DNA reacts with Biuret through ______________, and shows an absorbance in the visual region at _____...
A: DNA is also known as deoxyribonucleotide. DNA has double-stranded having two antiparallel strands wr...
Q: 4 draw the reaction mechanism for the formation of the covalent intermediate in the serine protease ...
A: Proteases are enzymes that break the peptide bond that joins amino acids in proteins. These enzymes ...
Q: Write a description of the physical characteristics of the isolated starch and glycogen. Provide the...
A: Physical characteristics are observable characteristics of a substance. Starch and glycogen are homo...
Q: Non-essential amino acids can be used to make essential amino acids through transamination. True ...
A: The amino acids that can not be synthesized in the body are called essential amino acids or indispen...
Q: When combining 0.5 mL of Lysozyme solution (with a concentration of 10 mg/ml) and 0.5 mL of water, w...
A: Lysozyme is an enzyme which catalyzes the hydrolysis of peptidoglycans present in cell walls of bact...
Q: What is the function of the buffer protein in the human body?
A: There are 3 types of buffer systems in our body. They are protein buffer system, phosphate buffer sy...
Q: Tables E & F. Hopkins-Cole and Bromine Water Reaction Samples TESTS Hopkin's Cole Bromine Water 1. T...
A: Hopkins' cole test The test is specific for the amino acid that contains the indole group present i...
Q: Would lactose + lactase be positive or negative for the Iodine test?
A: Lactose is a disaccharide that is commonly found in milk. Lactose is also known as milk sugar. Lacto...
Q: activity? To answer the question: a) name the hormone, controlling the lipid metabolism in adipocyte...
A: The breakdown or storage of fats for energy, as well as the production of structural and functional ...
Q: Write the word TRUE if the statement is correct and if not, underline the word or statement that mak...
A: CRISPR(clustered regularly interspaced short palindromic repeats)) is DNA sequences found in bacter...
Q: From the complete oxidation of glucose (glucose → 6CO2), how many total nucleotide triphosphates a...
A:
Q: I want to look the concentration values from these absorbance readings in order to make a graph of c...
A: The Lambert-Beer law states that the light absorbed by a compound is dependent on the concentration ...
Q: Give the identity of the monosaccharide components of the tetrasaccharide: А: B: C: D:
A:
Q: Differentiate between fibrous and globular proteins
A: On basis of shape and solubility, Proteins can be classified into two categories:- 1.Fibrous ,eg., ...
Q: Amino acids contain the following elements EXCEPT A. oxygen B. potassium C. carbohydrate D. h...
A: Amino acids are molecules that combine to form proteins. These are the building blocks of life.
Q: Describe the key contributors to and consequences of viral genome evolution, and state why RNA virus...
A: Genome is a set of information of genetic material for any organism. Usually the genome is stored a...
Q: 1. The pka of an acid is partly dependent on the environment of the acid. What will be the effect of...
A: According to the Henderson-Hasselbalch equation, which defines the relationship between the concentr...
Q: Cisplatin preferentially binds N? of the purines adenine and guanine. Draw the product of the follow...
A:
Q: Classify the following polysaccharides Chitin ...
A: The term "biomolecule" refers to a molecule created by living organisms or cells. The most common bi...
Q: Consider the function of the cofactor FAD. Which of the following makes it unique (different) from N...
A:
Q: How do microorganisms affect people directly and indirectly? List and describe: 1) products produce...
A: Organisms that are of microscopic size are called microorganisms. They are also called microbes and ...
Q: With the exception of Dermatan, the repeating disaccharide unit of glycosaminoglycans consists of ur...
A: The question is about the repeating disaccharide that found in the tissues of mammals in mucus and f...
Q: An incomplete (low quality) protein A. is a protein that is missing one or more of the essential...
A: Proteins are large biomolecules and macromolecules that comprise one or more long chains of amino ac...
Q: The compound tetraethylammonium (TEA) blocks the voltage-gated changes in potassium permeability tha...
A: Action potentials are known to be the source of neuronal transmission, in the form of electrical sig...
Q: Name a. at least 5 herbal extracts that are often the main ingredients in astringents and toners b...
A: Astringent and toner are similar. toner and astringents are liquid-based. Used to r...
Q: Butanoic acid (C3H7COOH) is described as a weak acid. Define the term weak acid
A: Acids are chemical compounds that taste sour and turn the blue litmus red. They have a pH of less th...
Q: Determine in descending order which lipid is most polar to least polar. Explain your answer.
A: Lipids are non-polar molecule that is soluble in nonpolar solvents. Lipids are involved in energy st...
Q: I. True or False. Write the word "reducing" if the statement is correct otherwise write "non-reducin...
A:

Step by step
Solved in 2 steps with 1 images

- . The photosynthetic process used by the green sulfur bacteria, under anaerobic conditions, is best represented by which of the following balanced equations? 6CO2 + 12H2S g C6H12O6 + 6S2 + 6H2O C6H12O6 + C6H12O6 g C12H22O11 + H2O 6CO2 + 12H2O g C6H12O6 + 6O2 + 6H2O C12H22O11 + H2O g C6H12O6 + C6H12O6 C6H12O6 + 6O2 + 6H2O g 6CO2 + 12H2OIn an experiment conduct to know the effect of light intensity on the rate of photosynthesis in spinach leaves, with the use of 5 ml of a 0.2% sodium bicarbonate (NaHCO3) and a solution of dilute drop of liquid soap. in relation this experiment, state an hypothesis that predicts the relationship between light intensity and the rate of photosynthesis. Identify independent and dependent variables. What is your control group, and why is this an appropriate control?How can the hypothesis that asserts that chloroplasts as well as mitochondria were primitive prokaryotes that associated in mutualism with primitive anaerobic eukaryotic cells be corroborated?
- Aerobic respiration, used by the mitochondria of eukaryotic cells, is best represented by which of the following balanced equations? 6CO2 + 12H2S g C6H12O6 + 6S2 + 6H2O C6H12O6 + 6O2 + 6H2O g 6CO2 + 12H2O C12H22O11 + H2O g C6H12O6 + C6H12O6 6CO2 + 12H2O g C6H12O6 + 6O2 + 6H2O C6H12O6 + C6H12O6 g C12H22O11 + H2OImagine that you develop a procedure to measure the pH of in the matrix and the intermembrane space of a mitochondrion. What pattern of pH would you see? The pH in the intermembrane space will contain more H+ and have a lower pH compared to the matrix. The pH in the intermembrane space will contain more H+ and have a higher pH compared to the matrix. The pH within the matrix will contain more H+ and have a lower pH compared to the intermembrane space. The pH within the matrix will contain more H+ and have a higher pH compared to the intermembrane space.What is the structure of the following abstract? Answers are sentence by sentence with punctuation preserved. Ageing is an irreversible cellular decline partly driven by failing mitochondrial integrity. Mitochondria accumulate DNA mutations and reduce ATP production necessary for cellular metabolism. This is associated with inflammation. Near-infrared exposure increases retinal ATP in old mice via cytochrome c oxidase absorption and reduces inflammation. Here, we expose fruitflies daily to 670 nm radiation, revealing elevated ATP and reduced inflammation with age. Critically, there was a significant increase in average lifespan: 100–175% more flies survived into old age following 670 nm exposure and these had significantly improved mobility. This may be a simple route to extending lifespan and improving function in old age. B=Background Q=Question A=Approach R=Result L=Literal Interpretation S=Speculative interpretation Q. B. B. B. R,L. S:S. L. B. B. B. B. A,L.…
- Part 1Contents of GlassCircumference of Glass (cm)Height of Foam (cm)Estimated volume of CO2 (cm3)Yeast exposed to sugarYeast exposed to corn starchOnly yeast (Control group) Questions:1. Which glass of yeast produced foam fastest? Why? Which glass of yeast is the slowest to produce foam? Why? Do the results of this experiment support your hypothesis? What was the independent variable in this experiment? What was the dependent variable in this experiment? What do you expect would happen if you increased the amount of sugar?Predict the relative amounts of gas production by yeast when using the following carbohydrates as fuel sources: 5% glucose (monosaccharide)When making bread with common yeast, the reaction starts as an aerobic process and then becomes an anaerobic process after the oxygen is spent. A baker has created a new strain of yeast which contains no cytochrome c gene and, thus, no cytochrome c protein. This will affect what the yeast strain can do to obtain energy. Use the passage to answer the question. Since the air bubbles in bread are generated by yeast, how will the spaces in this bread compare to those in a loaf made using normal yeast? A. more bubbles B. differently-shaped bubbles C. smaller bubbles D. bubbles more on the interior of the loaf
- What evidence supports the idea that the mitochondrion andchloroplast were once free-living members of the domainBacteria?Eukaryotic mitochondria consume exactly how many substrate molecules, in their production of six carbon dioxide molecules and twelve water molecules, during aerobic respiration? one C6H12O6 molecule, six H2O molecules, and six O2 molecules are consumed twelve C6H12O6 molecules, six H2O molecules, and three CO2 molecules are consumed six H2O molecules and twelve CO2 molecules are consumed six C6H12O6 molecules, three H2O molecules, and six CO2 molecules are consumed twelve H2O molecules and six O2 molecules are consumedDuring aerobic respiration in the mitochondria of eukaryotes, which substrate molecules provide the oxygen atoms that end up in product carbon dioxide molecules? C6H12O6, H2O, and O2 only H2O and C6H12O6 only C6H12O6 and O2 only H2O only O2 only
