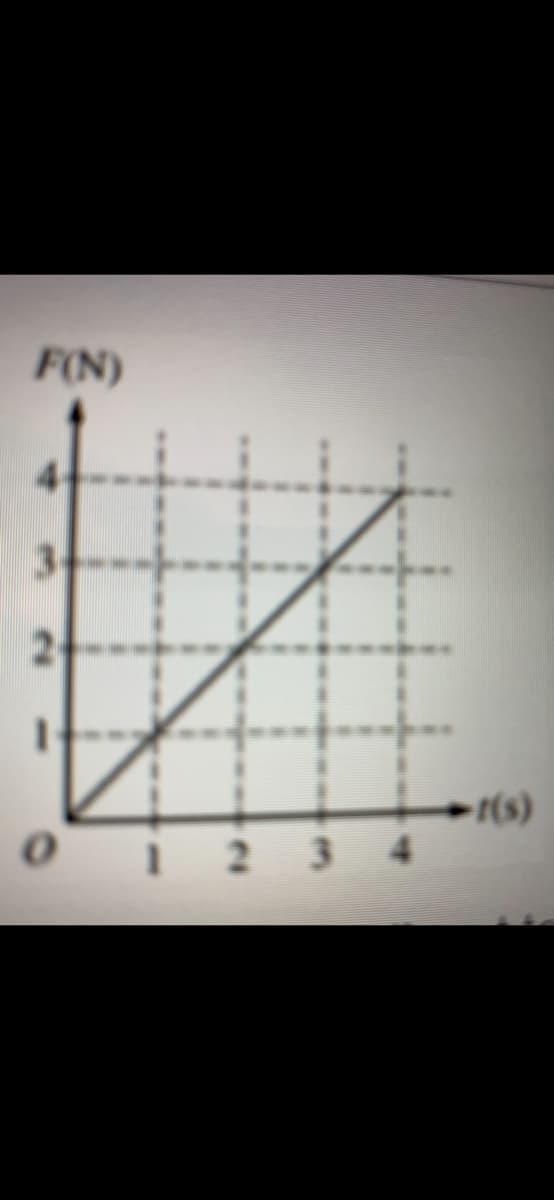
The graph illustrates variable force F being applied for time t to an object which moves horizontally in a straight line. Calculate the change in momentum of the object 1 between 2s and 4s. A. 4kg*m/s B. 6kg*m/s C. 2kg*m/s D. 8kg*m/s

Q: please help with 3
A: The given graph is between velocity and time. Velocity of the object is marked on the y axis and tim...
Q: A 10,000 kg shipping container is on a truck moving at 75 mph on a flat road. The driver brings the ...
A:
Q: A small remote-control car with a mass of 1.53 kg moves at a constant speed of v = 12.0 m/s in a ver...
A: a) normal force at A N= mg + m v^2/ r = 1.53* 9.8 + 1.53* 12* 12 / 5 N= 59.058 N
Q: Discussion: Q 1: Calculate: 4 - Band (Red Green Black Gold).
A:
Q: The density of ice is 917 kg/m3, and the approximate density of the seawater in which an iceberg flo...
A: Given data: The density of the ice is ρ1=917 kg/m3. The density of seawater is ρ2=1025 kg/m3. Let,...
Q: Suppose the isosceles prism of the figure has apex angle p = 50.9° and index of refraction %3D
A: Question 9: Given: Apex angle =50.9 Index of refraction n=1.52
Q: The mass gains speed.
A:
Q: 16- A photodiode with a energy gap of 2.35 eV. It operates at 300 K and If it is illuminated by ligh...
A: Given data: The band-gap energy is Eg=2.35 eV. The temperature is T=300 K. The wavelength is λ=400 ...
Q: Determine the specific volume of superheated water vapor at (20x6) bar and 440 °C based on: a) the i...
A: It is given that : water vapour pressureP= (20×6)bar water vapour temperature T= 4400C The assumptio...
Q: A fully loaded, slow-moving freight elevator has a cab with a total mass of 1200 kg, which is requir...
A: 950 kg of cab is balanced by the counterweight. Thus the motor has to pull the additional weight of ...
Q: Solve one-dimensional wave equation by canonical reduction by considering u1(x, t) = 4(x – ct) and u...
A: Considering the wave equation as the combination of two given waves, that is, Z= u1 + u2 Z = ϕ(x-ct)...
Q: Please and thank you for your help!
A: Given is : G = 6.673 × 10⁻¹¹ N m2 kg-2 M mass of Jupiter = 1.899×1027 kg ...
Q: Two cars collide in a head-on collision. Car 1 has a mass of 1875 kg and was traveling at a speed o...
A: Let m1 and m2 denote the masses of car 1 and 2, u1 and u2 denote the speed of car 1 and 2 just befor...
Q: Q.1 As shown in the figures below. At point P, deduce the magnitude and direction of the magnetic fi...
A:
Q: At relativistic speeds near that of light, the half-life of an unstable particle moving at high spee...
A: Given At relativistic speeds near that of light, as following below.
Q: Q: Assuming the ideal diode model (Von=0 V), calculate VouT for the circuits in Figures (b) and (c) ...
A: In question , we are given two circuits and we need to find its output. given that for on positi...
Q: Rank, from smallest to largest, the pressures in the tank of motionless fluid shown in the figure. (...
A: Let P be defined as the pressure, then P=hρg Here, h is the height from the surface. ρ is the densit...
Q: The force stretching the D string on a certain guitar is 148 N. The string's linear mass density is ...
A: Given: Force,F=148 NMass density,μ=.007 kg/mFind the speed of waves on string,v=?
Q: a) Find the inverse Fourier transform of the following: i. 1 ii. 4 V2n (4+w?) 1 iII. νω2π(2- jω).
A: (a) (i) 5w We know fourier transform of sgn(t) is sgn(t)↔F.T.2jw=25j5wInverse fourier transform of 5...
Q: A beaker when partly filled with water has a total mass of 20.00 g. A piece of metal with density 3....
A: Given: Mass(m)=20g=0.02 kg density(σ)=3g/cm3 volume(V)=1cm3 =1×10⁻⁶m The gravity (g) is 9.8m/s2
Q: 2–2. If the magnitude of the resultant force is to be 500 N, directed along the positive y axis, det...
A:
Q: Consider a ring of charge. The ring is in the x-y plane and has a radius of 3.5 m. The charge per ...
A:
Q: Given the system in figure 3 consist of three springs joinccl end to end, the tension, w, in cach of...
A: lets draw FBD of each spring, all the spring are massless and tension in springs are Tx, Ty, Tz resp...
Q: Benzene is flowing through a pipe at a rate of 150 lb/hr. The specific gravity of benzene is 0.879. ...
A: Given data in this problem is :⇒Flow rate (Q) = 150 lbhr⇒Specific gravity(s.g.) = 0.879 :Hence, dens...
Q: A step-index multimode glass fiber has a core diameter of 50 µm and cladding refractive index of 1.4...
A: Given, core diameter is 50μm refractive index= 1.45 a. For a multimode step index fiber modal disper...
Q: At time T energy measurement is carried out on One Hundred identical harmonic oscillator systems wit...
A: There is one hundred identical harmonic system with angular frequency . Given is : when 36 syst...
Q: A 1.4-kg wheel in the shape of a cylindrical hoop of radius 0.20 m acquires a rotational rate of 180...
A: NOTE: Out of given various parts of a question, we solve only first three parts unless specified. Y...
Q: A projectile is launched from point A with the initial conditions shown in the figure. Determine the...
A: Given, v0=341 ft θ=31°y=x tanθ-gx22 u2cos2θx=2515 (1980+535), u=v0=341g=32.17 ft/s2substituting the ...
Q: Find the force F acting on the charge q = 12 nC, located on the axis of the ring at a distance of h ...
A: The linear charge density τ is given as, dQ=τdx=τrdθ Thus the force on the charge q is given as, df=...
Q: A square, single-turn wire loop { = 1.00 cm on a side is placed inside a solenoid that has a circula...
A:
Q: A long cylindrical non-magnetic conductor of radius Ro, whose axis coincides with the ê-axis, carrie...
A: Ampere's law states that the magnetic field over a close path of length is proportional to the curre...
Q: (H.W) If a person walk 1km north, 5km west, 3km south, ans 7km east, find the resultant displacement...
A: Given: The person walks 1 km North then 5 km west after this he walks 3 km south and then 7 km east....
Q: A sample of mpoist air has a dry bulb temperature (DBT) of 43 °C and a wet bulb temperature (WBT) of...
A:
Q: 6-
A:
Q: A pulse in a more dense medium is traveling towards the boundary with a less dense medium. Medium 1 ...
A: The amplitude of incident wave is nearly equal to the transmitted wave.
Q: For the given input waveform to the given circuit, what is the minimum value of the output waveform?...
A: We have to understand the diagram.
Q: 19. Three lenses with focal lengths of +8.40, - 4.60, and +6.20 cm, respectively, are located one be...
A:
Q: Realize given compound proposition by a contact circuit: A(p, q, r) = p → (¬q ® r).
A: Here given is three component q , p , r. T refers as truth and F refers for false . Truth table of g...
Q: Please solve
A: An ice cube's 1thn portion sinks in water . The downward force that acts on ice is weight (mg) is eq...
Q: Please answer g, h, i
A: Part (g) The electric field due to –Q point charge inside the first cavity can be written using sta...
Q: y В (15.0 m) D (10.0 m) 30.0° 53.0° 25.0° С 12.0 m) А (8.00 m)
A: Here the vectors can be resolved into the x and y components D→=10.0 m, B→=15.0 mBx=B→ sin 30°=7.5 ...
Q: 14. A region of space contains a uniform electric field, directed toward the right, as shown in the ...
A:
Q: Is the Earth flat or spherical? Prove this with physical equations and evidence
A: The earth is imperfectly spherical and there are evidence and experiments one can try to do to see i...
Q: Assuming your acceleration is constant ,does your footwear qualify for the postal regulation?
A: Given: The static friction's coefficient is 0.5 The distance and time to move from rest is 4.23 m an...
Q: In figure 1 there is a charge qt= -2.55mC and qs = 5.50nC in an electric field E= 405 N/C. What dist...
A:
Q: Which of the following is an example of qualitative data? A car is traveling at 45 mph OA. A car wei...
A: A qualitative data can be defined as the data that approximates and characterizes . These type of da...
Q: 1- Calculate the maximum range of radar which operate at a frequency of 15 GHz, peak pulse power (tr...
A: Given data : Peak power transmitted by the Radar, Pt=1 MW = 1000 K W Gain of transmitting Antenna...
Q: The direct impact between two balls where they have different velocities. 1. Ball A and Ball B have ...
A: two bodies of mass m and different velocities v1 and v2 Using conservation of momentum m1u1+m2u2=m...
Q: 6.16 A 1200-kg car is coasting down a 30° hill as shown in Fig. 6-4. At a time when the car's speed ...
A: Given: The mass of car is m=1200 kg. The angle of inclination of hill is θ=30∘. The initial speed o...
Q: The tank shown in Figure is kept filled with water to a depth of 8.0 m. Find the speed vb, with whi...
A: Bernoulli's principle states that a decrement in the pressure of a fluid or a decrement in the poten...


Trending now
This is a popular solution!

Step by step
Solved in 4 steps with 4 images
