The graph of a curve in polar coordinates is shown below and you are highlights in red a region bounded by said curve and the y axis. (See the graph in the images) The approximate area of said region corresponds to: A) 0.2226 (ul)2 B) 0.0356 (ul)2 C) 0.1142 (ul)2 D) 0.4440 (ul)2
The graph of a curve in polar coordinates is shown below and you are highlights in red a region bounded by said curve and the y axis. (See the graph in the images) The approximate area of said region corresponds to: A) 0.2226 (ul)2 B) 0.0356 (ul)2 C) 0.1142 (ul)2 D) 0.4440 (ul)2

Algebra & Trigonometry with Analytic Geometry
13th Edition
ISBN:9781133382119
Author:Swokowski
Publisher:Swokowski
Chapter7: Analytic Trigonometry
Section7.4: Multiple-angle Formulas
Problem 29E

Related questions
Question
The graph of a curve in polar coordinates is shown below and you are
highlights in red a region bounded by said curve and the y axis.
(See the graph in the images)
The approximate area of said region corresponds to:
A) 0.2226 (ul)2
B) 0.0356 (ul)2
C) 0.1142 (ul)2
D) 0.4440 (ul)2
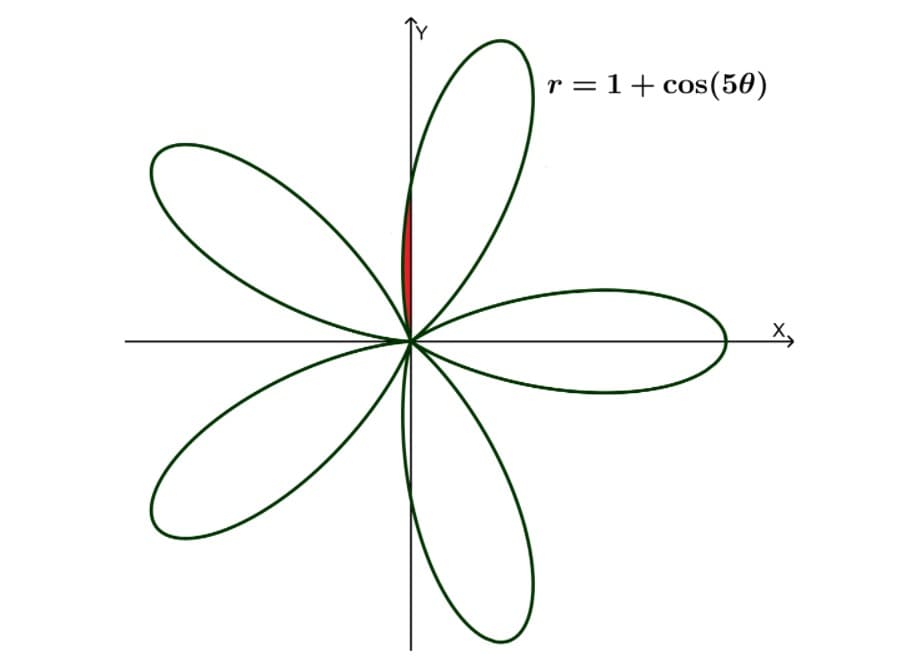
Transcribed Image Text:r = 1+ cos(50)
Expert Solution
This question has been solved!
Explore an expertly crafted, step-by-step solution for a thorough understanding of key concepts.

Step by step
Solved in 3 steps with 2 images

Recommended textbooks for you
Algebra & Trigonometry with Analytic Geometry
Algebra
ISBN:
9781133382119
Author:
Swokowski
Publisher:
Cengage
Algebra & Trigonometry with Analytic Geometry
Algebra
ISBN:
9781133382119
Author:
Swokowski
Publisher:
Cengage