The graph of a function f is given. Use the graph to estimate the following. y 5 (a) All the local maximum and minimum values of the function and the value of x at which each occurs. local maximum (х, у) %3D (smaller x-value) local maximum (x, y) = (larger x-value) local minimum (x, y) = (b) The intervals on which the function is increasing and on which the function is decreasing. (Enter your answers using interval notation.) increasing decreasing
The graph of a function f is given. Use the graph to estimate the following. y 5 (a) All the local maximum and minimum values of the function and the value of x at which each occurs. local maximum (х, у) %3D (smaller x-value) local maximum (x, y) = (larger x-value) local minimum (x, y) = (b) The intervals on which the function is increasing and on which the function is decreasing. (Enter your answers using interval notation.) increasing decreasing

Chapter2: Functions And Their Graphs
Section: Chapter Questions
Problem 11T

Related questions
Question
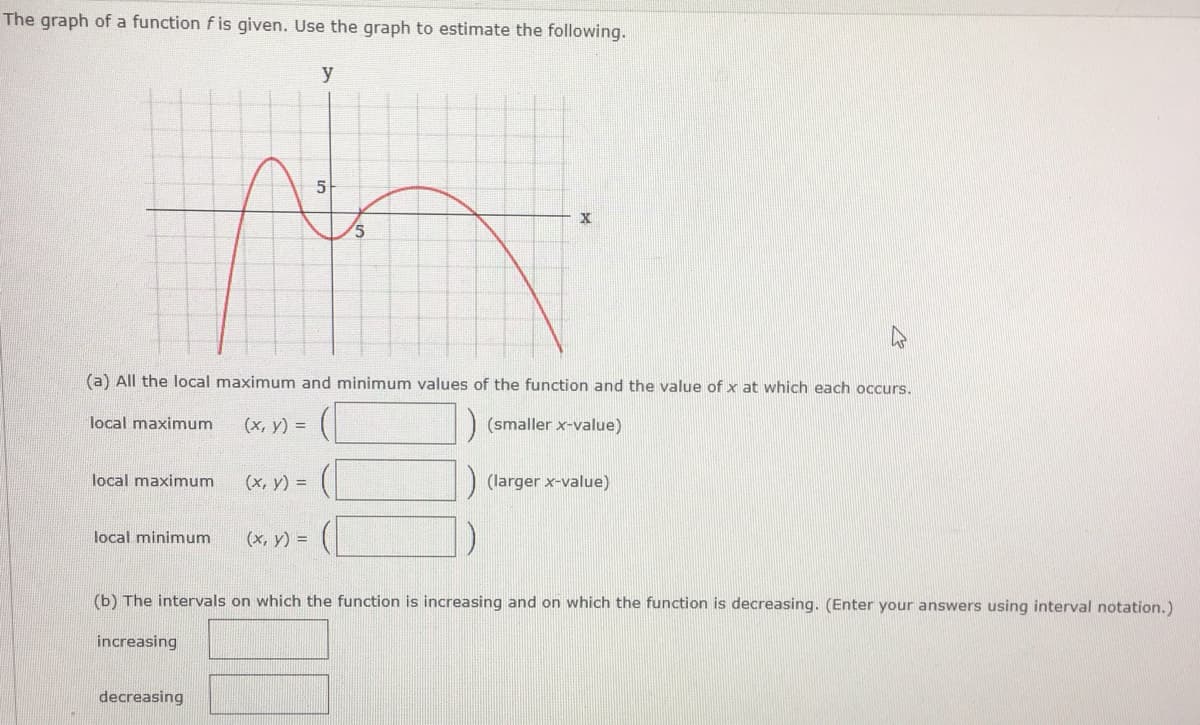
Transcribed Image Text:The graph of a function f is given. Use the graph to estimate the following.
y
5
5
(a) All the local maximum and minimum values of the function and the value of x at which each occurs.
local maximum
(х, у) %3D
) (smaller x-value)
local maximum
(x, y) =
) (larger x-value)
local minimum
(x, y) =
(b) The intervals on which the function is increasing and on which the function is decreasing. (Enter your answers using interval notation.)
increasing
decreasing
Expert Solution
This question has been solved!
Explore an expertly crafted, step-by-step solution for a thorough understanding of key concepts.

Step by step
Solved in 2 steps with 2 images

Recommended textbooks for you

Algebra & Trigonometry with Analytic Geometry
Algebra
ISBN:
9781133382119
Author:
Swokowski
Publisher:
Cengage

Big Ideas Math A Bridge To Success Algebra 1: Stu…
Algebra
ISBN:
9781680331141
Author:
HOUGHTON MIFFLIN HARCOURT
Publisher:
Houghton Mifflin Harcourt
Algebra & Trigonometry with Analytic Geometry
Algebra
ISBN:
9781133382119
Author:
Swokowski
Publisher:
Cengage
Big Ideas Math A Bridge To Success Algebra 1: Stu…
Algebra
ISBN:
9781680331141
Author:
HOUGHTON MIFFLIN HARCOURT
Publisher:
Houghton Mifflin Harcourt