The graph of an exponential function is shown below as a solid blue curve and its asymptote is drawn as a red dotted line. Use this graph to find the equation of the plotted exponential function, or f(x), with base b = 2. 2 -10 -8 -6 -4 -2 6. 10 -2 (4, –4) (5,-3) -6 pdwered by desmos Note that reflections and shifts (but not stretches or compressions) have been performed on the basic exponential function y = 2ª to obtain the blue curve. The coordinates of two points on f(x) have been provided to assist your analysis. The coordinates of the black point are the result of transformations on the point (0, 1) of the basic exponential function. You may also click on any other point on the function to find its coordinates. 4.
The graph of an exponential function is shown below as a solid blue curve and its asymptote is drawn as a red dotted line. Use this graph to find the equation of the plotted exponential function, or f(x), with base b = 2. 2 -10 -8 -6 -4 -2 6. 10 -2 (4, –4) (5,-3) -6 pdwered by desmos Note that reflections and shifts (but not stretches or compressions) have been performed on the basic exponential function y = 2ª to obtain the blue curve. The coordinates of two points on f(x) have been provided to assist your analysis. The coordinates of the black point are the result of transformations on the point (0, 1) of the basic exponential function. You may also click on any other point on the function to find its coordinates. 4.

Functions and Change: A Modeling Approach to College Algebra (MindTap Course List)
6th Edition
ISBN:9781337111348
Author:Bruce Crauder, Benny Evans, Alan Noell
Publisher:Bruce Crauder, Benny Evans, Alan Noell
Chapter2: Graphical And Tabular Analysis
Section2.4: Solving Nonlinear Equations
Problem 9E: A Population of Foxes A breeding group of foxes is introduced into a protected area, and the...

Related questions
Question
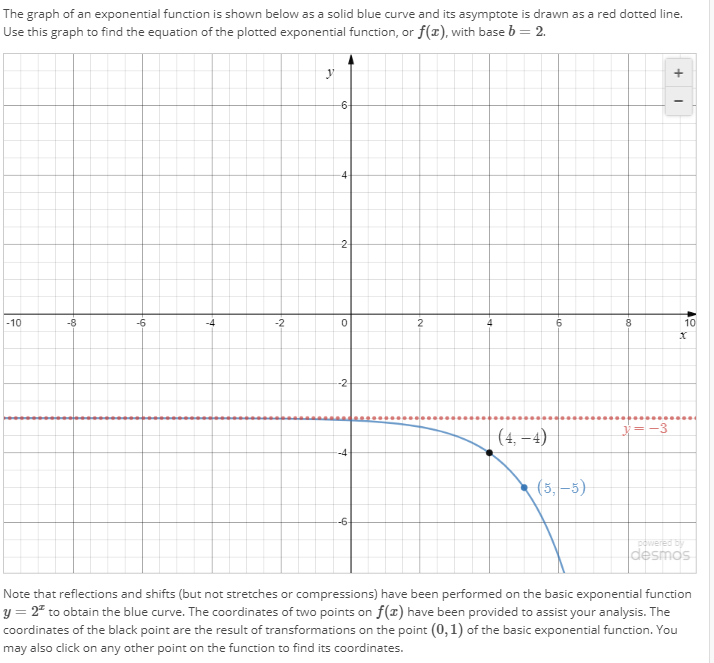
Transcribed Image Text:The graph of an exponential function is shown below as a solid blue curve and its asymptote is drawn as a red dotted line.
Use this graph to find the equation of the plotted exponential function, or f(x), with base b = 2.
2
-10
-8
-6
-4
-2
6.
10
-2
(4, –4)
(5,-3)
-6
pdwered by
desmos
Note that reflections and shifts (but not stretches or compressions) have been performed on the basic exponential function
y = 2ª to obtain the blue curve. The coordinates of two points on f(x) have been provided to assist your analysis. The
coordinates of the black point are the result of transformations on the point (0, 1) of the basic exponential function. You
may also click on any other point on the function to find its coordinates.
4.
Expert Solution
This question has been solved!
Explore an expertly crafted, step-by-step solution for a thorough understanding of key concepts.

This is a popular solution!

Trending now
This is a popular solution!

Step by step
Solved in 4 steps with 6 images

Knowledge Booster


Learn more about
Need a deep-dive on the concept behind this application? Look no further. Learn more about this topic, calculus and related others by exploring similar questions and additional content below.Recommended textbooks for you
Functions and Change: A Modeling Approach to Coll…
Algebra
ISBN:
9781337111348
Author:
Bruce Crauder, Benny Evans, Alan Noell
Publisher:
Cengage Learning


Algebra & Trigonometry with Analytic Geometry
Algebra
ISBN:
9781133382119
Author:
Swokowski
Publisher:
Cengage
Functions and Change: A Modeling Approach to Coll…
Algebra
ISBN:
9781337111348
Author:
Bruce Crauder, Benny Evans, Alan Noell
Publisher:
Cengage Learning
Algebra & Trigonometry with Analytic Geometry
Algebra
ISBN:
9781133382119
Author:
Swokowski
Publisher:
Cengage

Algebra and Trigonometry (MindTap Course List)
Algebra
ISBN:
9781305071742
Author:
James Stewart, Lothar Redlin, Saleem Watson
Publisher:
Cengage Learning

College Algebra
Algebra
ISBN:
9781305115545
Author:
James Stewart, Lothar Redlin, Saleem Watson
Publisher:
Cengage Learning

Glencoe Algebra 1, Student Edition, 9780079039897…
Algebra
ISBN:
9780079039897
Author:
Carter
Publisher:
McGraw Hill