The graph of an exponential relationship is shown in the following applet. P1 = (0.00, 2.00) P2= (2.00, 2.54) 30 25 20 15 |10 P1 P2 2 3 5 Drag the purple X on the horizontal axis to vary the value of x and to see the function value f(x) as well as the function value after a change in x of 2 units ( Ax = 2). %3D a. Vary the value of x by sliding the purple "X" on the horizontal axis. As you do, think a what the lengths of the blue segments represent and pay attention to the values of the o pairs in the top right corner. b. The 2-unit growth factor is Preview c. The 1-unit growth factor is Preview d. What is the 8-unit percent change for the function values? % Preview
The graph of an exponential relationship is shown in the following applet. P1 = (0.00, 2.00) P2= (2.00, 2.54) 30 25 20 15 |10 P1 P2 2 3 5 Drag the purple X on the horizontal axis to vary the value of x and to see the function value f(x) as well as the function value after a change in x of 2 units ( Ax = 2). %3D a. Vary the value of x by sliding the purple "X" on the horizontal axis. As you do, think a what the lengths of the blue segments represent and pay attention to the values of the o pairs in the top right corner. b. The 2-unit growth factor is Preview c. The 1-unit growth factor is Preview d. What is the 8-unit percent change for the function values? % Preview

Algebra & Trigonometry with Analytic Geometry
13th Edition
ISBN:9781133382119
Author:Swokowski
Publisher:Swokowski
Chapter5: Inverse, Exponential, And Logarithmic Functions
Section5.3: The Natural Exponential Function
Problem 27E

Related questions
Question
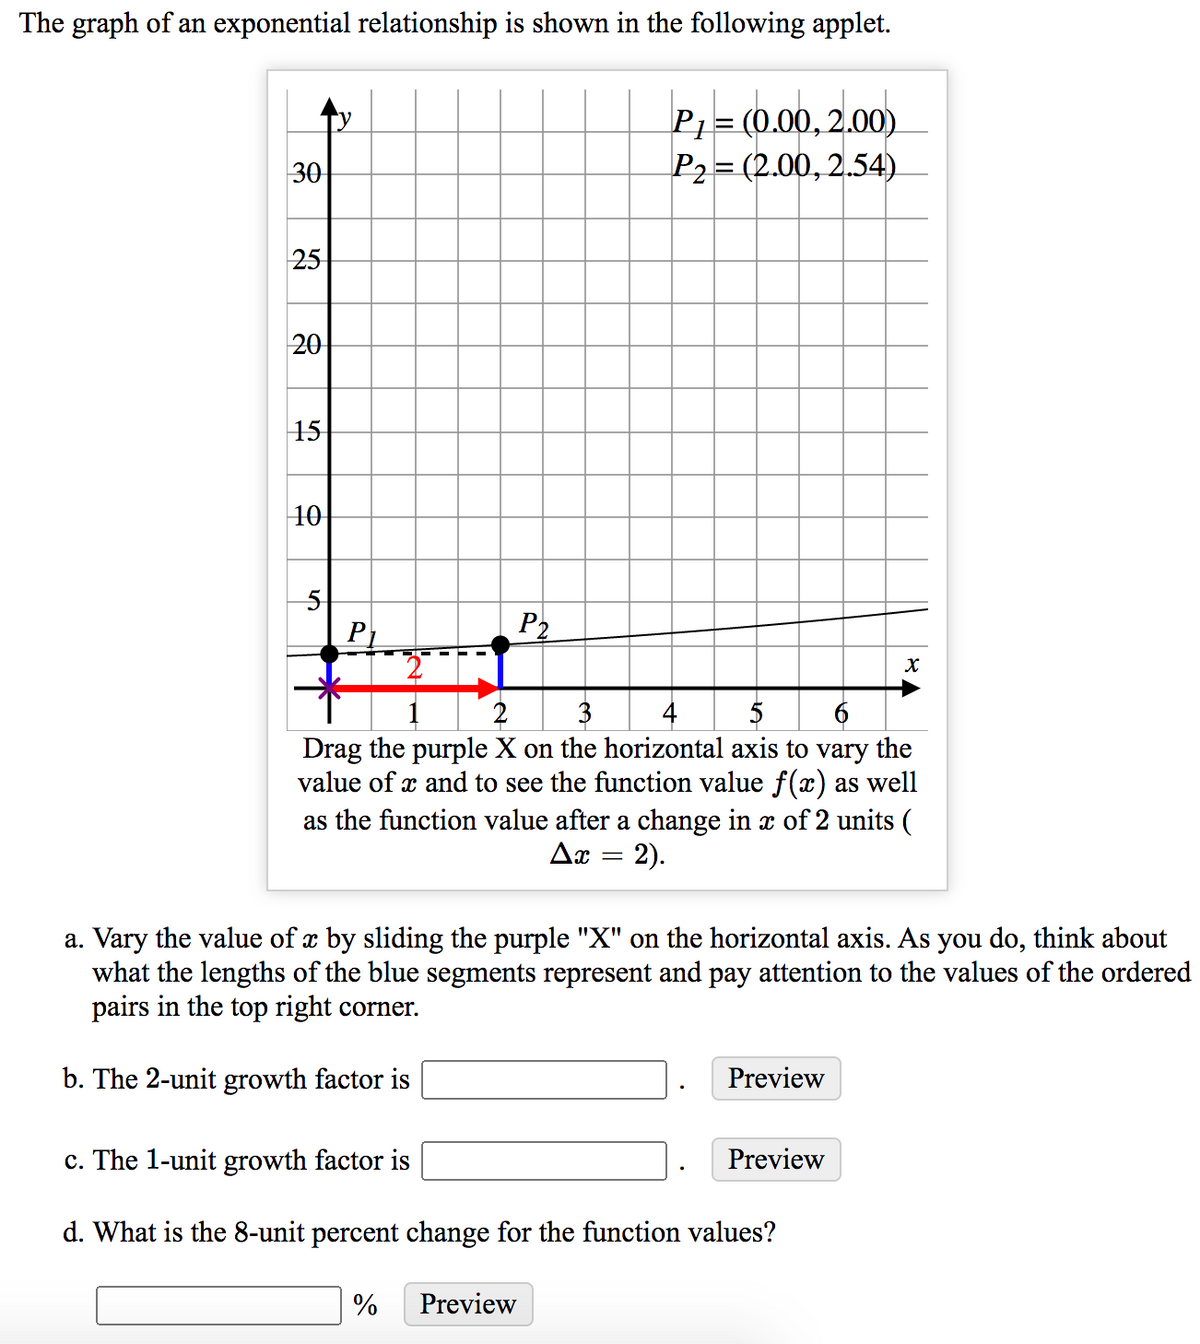
Transcribed Image Text:The graph of an exponential relationship is shown in the following applet.
P1= (0.00, 2.00)
P2= (2.00, 2.54)
30
25
20
15
10
P1
P2
2
3
4
Drag the purple X on the horizontal axis to vary the
value of x and to see the function value f(x) as well
as the function value after a change in x of 2 units (
2).
a. Vary the value of x by sliding the purple "X" on the horizontal axis. As you do, think about
what the lengths of the blue segments represent and pay attention to the values of the ordered
pairs in the top right corner.
b. The 2-unit growth factor is
Preview
c. The 1-unit growth factor is
Preview
d. What is the 8-unit percent change for the function values?
%
Preview
Expert Solution
This question has been solved!
Explore an expertly crafted, step-by-step solution for a thorough understanding of key concepts.

This is a popular solution!

Trending now
This is a popular solution!

Step by step
Solved in 2 steps with 2 images

Recommended textbooks for you
Algebra & Trigonometry with Analytic Geometry
Algebra
ISBN:
9781133382119
Author:
Swokowski
Publisher:
Cengage


Functions and Change: A Modeling Approach to Coll…
Algebra
ISBN:
9781337111348
Author:
Bruce Crauder, Benny Evans, Alan Noell
Publisher:
Cengage Learning
Algebra & Trigonometry with Analytic Geometry
Algebra
ISBN:
9781133382119
Author:
Swokowski
Publisher:
Cengage
Functions and Change: A Modeling Approach to Coll…
Algebra
ISBN:
9781337111348
Author:
Bruce Crauder, Benny Evans, Alan Noell
Publisher:
Cengage Learning

Algebra and Trigonometry (MindTap Course List)
Algebra
ISBN:
9781305071742
Author:
James Stewart, Lothar Redlin, Saleem Watson
Publisher:
Cengage Learning

Glencoe Algebra 1, Student Edition, 9780079039897…
Algebra
ISBN:
9780079039897
Author:
Carter
Publisher:
McGraw Hill

College Algebra
Algebra
ISBN:
9781305115545
Author:
James Stewart, Lothar Redlin, Saleem Watson
Publisher:
Cengage Learning