The graph of the function shown to the right illustrates a certain stock market index for the year 2010. Each tic mark on the horizontal axis represents the first opening day of the market for that given month. Use the graph to answer the following parts. a. Over which month(s) did the index decrease? Select all that apply. Jan, Feb, Mar, Apr, May, June, July, August, Sep, Oct, Nov, Dec b. b. Over which month(s) did the index stay relatively the same? Select all that apply. Jan, Feb, Mar, Apr, May, Jun, Jul, Aug, Sep, Oct, Nov, Dec c. Over which month(s) did the index increase? Select all that apply. Jan, Feb, Mar, Apr, May, Jun, Jul, Aug, Sep, Oct, Nov, Dec d. over the month of _____the value was increased most rapidly.
The graph of the function shown to the right illustrates a certain stock market index for the year 2010. Each tic mark on the horizontal axis represents the first opening day of the market for that given month. Use the graph to answer the following parts. a. Over which month(s) did the index decrease? Select all that apply. Jan, Feb, Mar, Apr, May, June, July, August, Sep, Oct, Nov, Dec b. b. Over which month(s) did the index stay relatively the same? Select all that apply. Jan, Feb, Mar, Apr, May, Jun, Jul, Aug, Sep, Oct, Nov, Dec c. Over which month(s) did the index increase? Select all that apply. Jan, Feb, Mar, Apr, May, Jun, Jul, Aug, Sep, Oct, Nov, Dec d. over the month of _____the value was increased most rapidly.

Algebra & Trigonometry with Analytic Geometry
13th Edition
ISBN:9781133382119
Author:Swokowski
Publisher:Swokowski
Chapter5: Inverse, Exponential, And Logarithmic Functions
Section: Chapter Questions
Problem 78RE

Related questions
Question
|
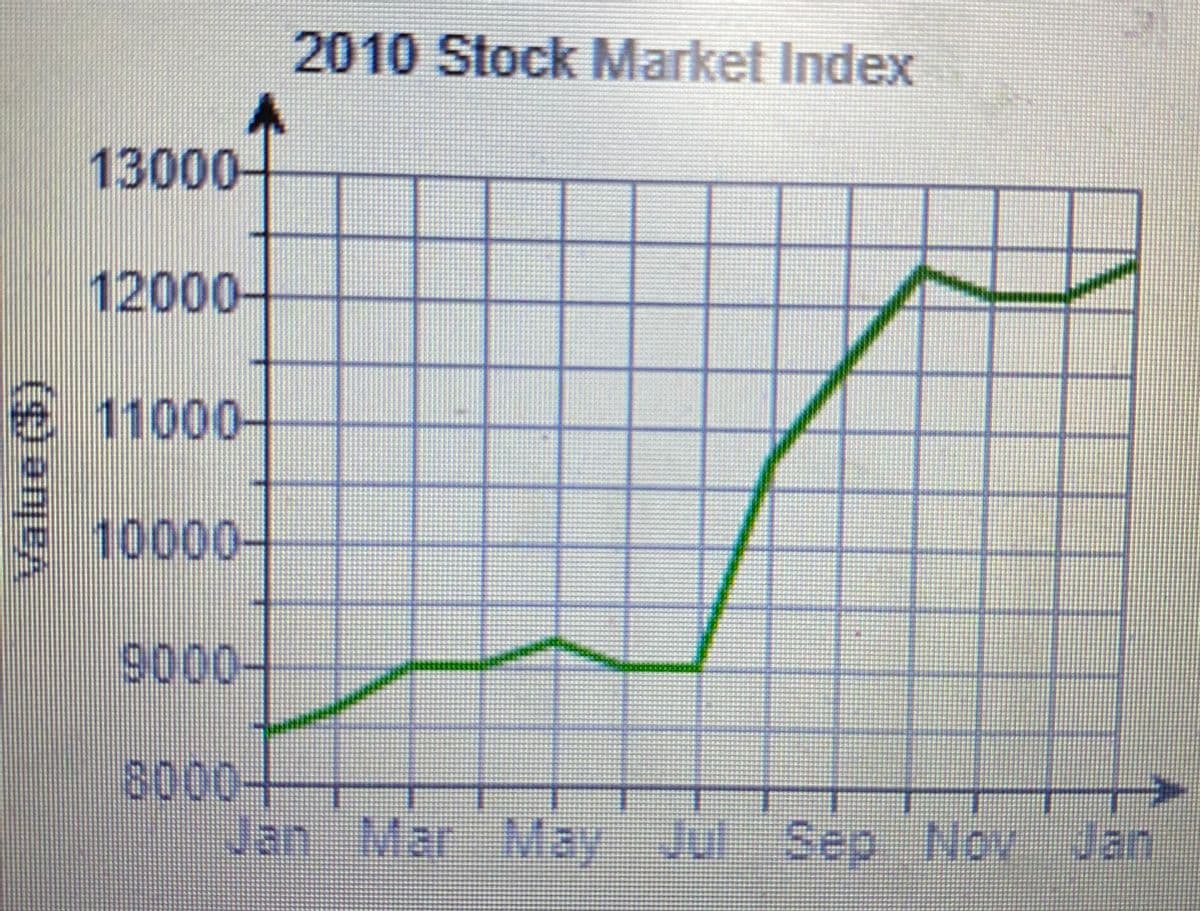
The graph of the function shown to the right illustrates a certain stock market index for the year 2010. Each tic mark on the horizontal axis represents the first opening day of the market for that given month. Use the graph to answer the following parts.
|
a. Over which month(s) did the index decrease? Select all that apply.
Jan, Feb, Mar, Apr, May, June, July, August, Sep, Oct, Nov, Dec
b. b. Over which month(s) did the index stay relatively the same? Select all that apply.
Jan, Feb, Mar, Apr, May, Jun, Jul, Aug, Sep, Oct, Nov, Dec
c. Over which month(s) did the index increase? Select all that apply.
Jan, Feb, Mar, Apr, May, Jun, Jul, Aug, Sep, Oct, Nov, Dec
d. over the month of _____the value was increased most rapidly.
*Please be accurate
Transcribed Image Text:2010 Stock Market Index
13000-
12000
11000-
10000
9000-
8000-
Jan Jul Sep Nov Jan
MarMay
Expert Solution
This question has been solved!
Explore an expertly crafted, step-by-step solution for a thorough understanding of key concepts.

This is a popular solution!

Trending now
This is a popular solution!

Step by step
Solved in 2 steps

Knowledge Booster


Learn more about
Need a deep-dive on the concept behind this application? Look no further. Learn more about this topic, algebra and related others by exploring similar questions and additional content below.Recommended textbooks for you
Algebra & Trigonometry with Analytic Geometry
Algebra
ISBN:
9781133382119
Author:
Swokowski
Publisher:
Cengage

Elementary Linear Algebra (MindTap Course List)
Algebra
ISBN:
9781305658004
Author:
Ron Larson
Publisher:
Cengage Learning

Elementary Algebra
Algebra
ISBN:
9780998625713
Author:
Lynn Marecek, MaryAnne Anthony-Smith
Publisher:
OpenStax - Rice University
Algebra & Trigonometry with Analytic Geometry
Algebra
ISBN:
9781133382119
Author:
Swokowski
Publisher:
Cengage
Elementary Linear Algebra (MindTap Course List)
Algebra
ISBN:
9781305658004
Author:
Ron Larson
Publisher:
Cengage Learning
Elementary Algebra
Algebra
ISBN:
9780998625713
Author:
Lynn Marecek, MaryAnne Anthony-Smith
Publisher:
OpenStax - Rice University