The graph of y = Vx is the solid black graph below. Which function represents the dotted graph? 10 8 3 -10 -9 -8 -7 -6 -5 -4 -3 3 4 х 5 9 10 -3 -4 -5 -6 -7 -8 O y = -Vx + 2 O y = -Vx Submit Answer Oy = v-x + 2 O y = V-x - 2
The graph of y = Vx is the solid black graph below. Which function represents the dotted graph? 10 8 3 -10 -9 -8 -7 -6 -5 -4 -3 3 4 х 5 9 10 -3 -4 -5 -6 -7 -8 O y = -Vx + 2 O y = -Vx Submit Answer Oy = v-x + 2 O y = V-x - 2

Algebra & Trigonometry with Analytic Geometry
13th Edition
ISBN:9781133382119
Author:Swokowski
Publisher:Swokowski
Chapter5: Inverse, Exponential, And Logarithmic Functions
Section5.2: Exponential Functions
Problem 60E

Related questions
Question
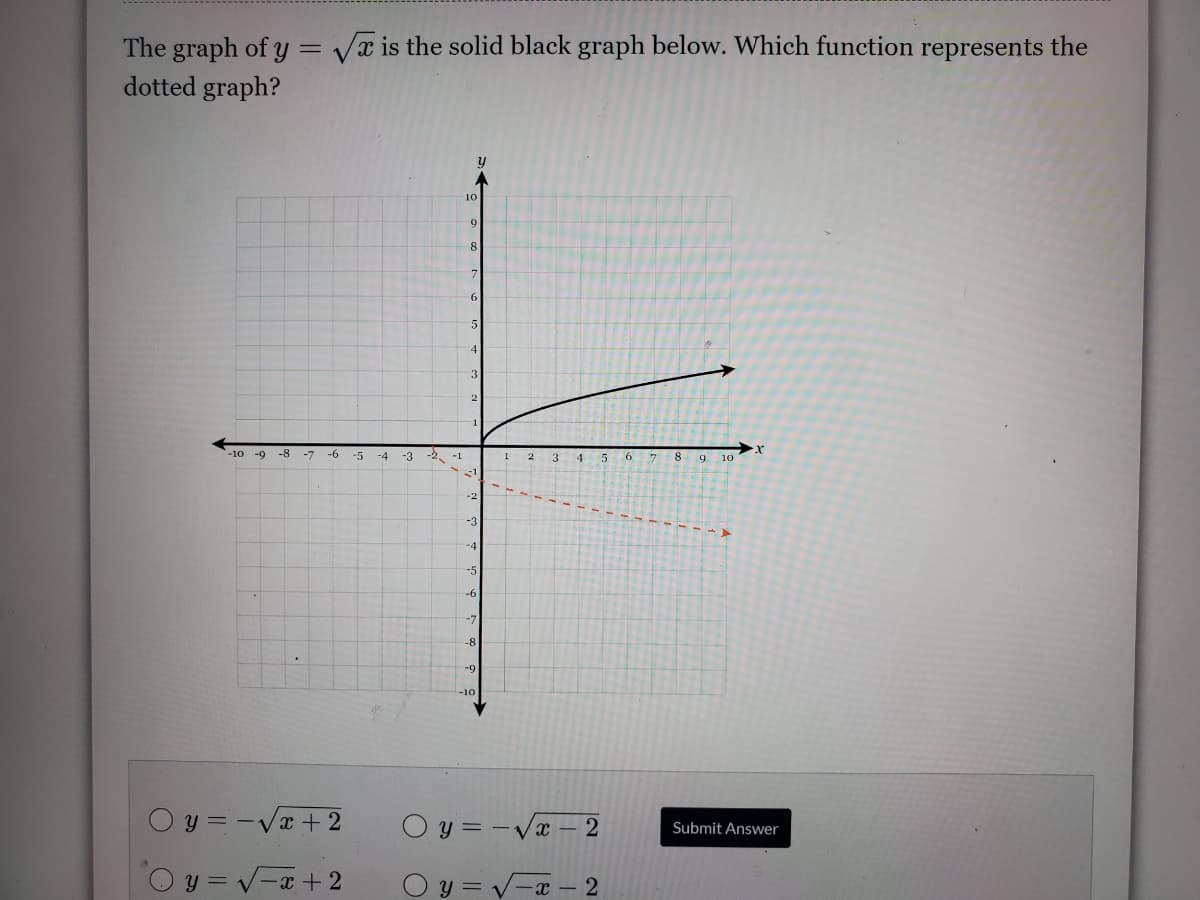
Transcribed Image Text:The graph of y = Vx is the solid black graph below. Which function represents the
dotted graph?
10
8
7
3
-10 -9
-8
-7
-6
-5
-4
-3
-2.
3 4
5
9 10
-3
-4
-5
-6
-7
-8
y = -Vx + 2
O y = -Vx
Submit Answer
O y = v-x + 2
O y = V-x – 2
Expert Solution
This question has been solved!
Explore an expertly crafted, step-by-step solution for a thorough understanding of key concepts.

This is a popular solution!

Trending now
This is a popular solution!

Step by step
Solved in 2 steps with 2 images

Recommended textbooks for you
Algebra & Trigonometry with Analytic Geometry
Algebra
ISBN:
9781133382119
Author:
Swokowski
Publisher:
Cengage
Algebra & Trigonometry with Analytic Geometry
Algebra
ISBN:
9781133382119
Author:
Swokowski
Publisher:
Cengage