The graph of y=f(z) is shown below (dashed curve). Manipulate the green draggable points to obtain the graph of y=f(z-3)-5 (solid curve). Do not let the two green points overlap as you will not be able to separate them. Sorry, that's incorrect. Try again? -10 -5 10 -5 5 10
The graph of y=f(z) is shown below (dashed curve). Manipulate the green draggable points to obtain the graph of y=f(z-3)-5 (solid curve). Do not let the two green points overlap as you will not be able to separate them. Sorry, that's incorrect. Try again? -10 -5 10 -5 5 10

Functions and Change: A Modeling Approach to College Algebra (MindTap Course List)
6th Edition
ISBN:9781337111348
Author:Bruce Crauder, Benny Evans, Alan Noell
Publisher:Bruce Crauder, Benny Evans, Alan Noell
Chapter1: Functions
Section1.2: Functions Given By Tables
Problem 32SBE: Does a Limiting Value Occur? A rocket ship is flying away from Earth at a constant velocity, and it...

Related questions
Question
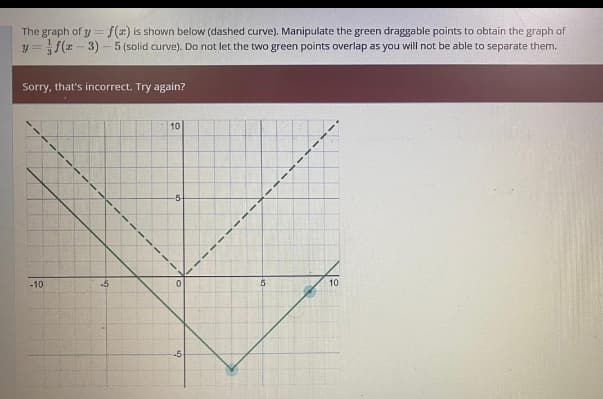
Transcribed Image Text:The graph of y = f(x) is shown below (dashed curve). Manipulate the green draggable points to obtain the graph of
y=f(x-3)-5 (solid curve). Do not let the two green points overlap as you will not be able to separate them.
Sorry, that's incorrect. Try again?
-10
-5
10
-5-
-5
5
10
Expert Solution
This question has been solved!
Explore an expertly crafted, step-by-step solution for a thorough understanding of key concepts.

Step by step
Solved in 3 steps with 3 images

Recommended textbooks for you
Functions and Change: A Modeling Approach to Coll…
Algebra
ISBN:
9781337111348
Author:
Bruce Crauder, Benny Evans, Alan Noell
Publisher:
Cengage Learning

Algebra & Trigonometry with Analytic Geometry
Algebra
ISBN:
9781133382119
Author:
Swokowski
Publisher:
Cengage
Functions and Change: A Modeling Approach to Coll…
Algebra
ISBN:
9781337111348
Author:
Bruce Crauder, Benny Evans, Alan Noell
Publisher:
Cengage Learning
Algebra & Trigonometry with Analytic Geometry
Algebra
ISBN:
9781133382119
Author:
Swokowski
Publisher:
Cengage