The graph on the right shows the remaining life expectancy, E, in years for females of age x. 60- (50.34.8) Find the average rate of change between the ages of 50 and 60. Describe what the average rate of change means in this situation. 40- (60 26 4) (70,19 5). (80 14 8) 20- 20 40 60 80 100 The average rate of change of life expectancy between the ages of 50 and 60 is (Type an integer or a decimal.) Life Expectanuy in years
The graph on the right shows the remaining life expectancy, E, in years for females of age x. 60- (50.34.8) Find the average rate of change between the ages of 50 and 60. Describe what the average rate of change means in this situation. 40- (60 26 4) (70,19 5). (80 14 8) 20- 20 40 60 80 100 The average rate of change of life expectancy between the ages of 50 and 60 is (Type an integer or a decimal.) Life Expectanuy in years

Glencoe Algebra 1, Student Edition, 9780079039897, 0079039898, 2018
18th Edition
ISBN:9780079039897
Author:Carter
Publisher:Carter
Chapter3: Linear And Nonlinear Functions
Section: Chapter Questions
Problem 26MCQ

Related questions
Question
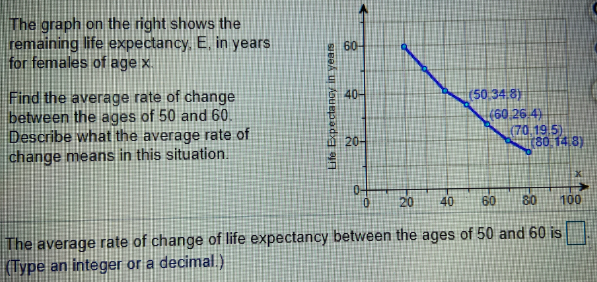
Transcribed Image Text:The graph on the right shows the
remaining life expectancy, E, in years
for females of age x.
60-
(50.34.8)
Find the average rate of change
between the ages of 50 and 60.
Describe what the average rate of
change means in this situation.
40-
(60 26 4)
(70,19 5).
(80 14 8)
20-
20
40
60
80
100
The average rate of change of life expectancy between the ages of 50 and 60 is
(Type an integer or a decimal.)
Life Expectanuy in years
Expert Solution
This question has been solved!
Explore an expertly crafted, step-by-step solution for a thorough understanding of key concepts.

This is a popular solution!

Trending now
This is a popular solution!

Step by step
Solved in 2 steps

Recommended textbooks for you
Glencoe Algebra 1, Student Edition, 9780079039897…
Algebra
ISBN:
9780079039897
Author:
Carter
Publisher:
McGraw Hill
Glencoe Algebra 1, Student Edition, 9780079039897…
Algebra
ISBN:
9780079039897
Author:
Carter
Publisher:
McGraw Hill