

Q: How is a CAM plant different from a C3 plant in terms of 1. area/region of growth 2. leaf…
A: The pathway by which all photosynthetic Eukaryotic organisms ultimately incorporate carbon dioxide…
Q: Explain why was acetone used as a blank for the chlorophyll absorption spectrum.
A: Acetone is used as an organic solvent characterized by colorless, volatile, and flammable liquid. It…
Q: Chewing insects mechanically damage plants and lessen the surface area of leaves for photosynthesis.…
A: Pathogens are those organisms that harms other organisms by colonising the organism's body. They do…
Q: What does this compound (juglone) cause and suggest reasons bchind walnut producing this compound.…
A: Walnuts are brain shape nuts with great nutritional value.
Q: how does temperature affect the process of gas exchange in desert plants?
A: The plants are formed of roots, stem, leaves, fruits and flowers. The conduction system in plants is…
Q: What is the process when plants taking in carbon dioxide
A: Plants take in carbon dioxide (CO2) and water (H2O) from the air and soil during photosynthesis.…
Q: How is a C4, C3 and CAM plant different in terms of 1. area/region of growth 2. leaf…
A: c4 plants are native to the tropics and warm temperate zones with high light intensity and high…
Q: Photosynthesis in some of the crops is efficient at this range of temperature a. 20°C - 30°C…
A: Photosynthesis is the process that produces organic matter from simple inorganic molecules, using…
Q: Which of the following statements is incorrect?a. Pigments absorb light of certain wavelengths…
A: Answer is c.) Chlorophyll is green because it absorbs green light.
Q: Why some plants show wilting of their leaves, even when the soil is well watered?
A: Wilting refers back to the lack of mobile turgidity in plants which ends withinside the drooping of…
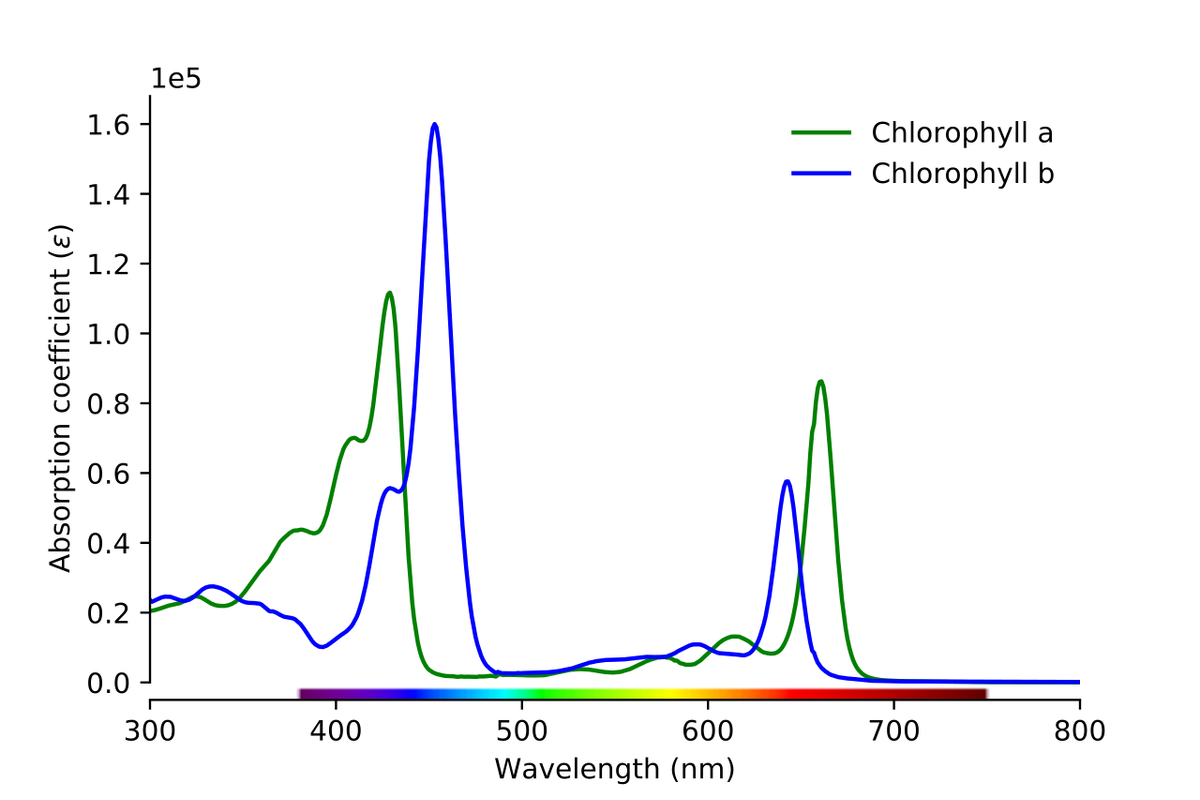
Q: Chlorophyll a and chlorophyll b both play roles in photosynthesis. Using no more than one sentence…
A:
Q: Compare and contrast chlorophylls with carotenoids
A: Introduction: The process of preparing food in the green plants and some other lower living beings…
Q: Give the LETTER and NAME of the: 3.2.1 Specialized cell in which photosynthesis takes place 3.2.2…
A: A cell is the basic structural and functional key of life. A cell has multiple organelles that carry…
Q: Would a higher leaf area index always increase the amount of photosynthesis? Explain.
A: Photosynthesis is a biochemical process occurring in the chloroplast of a plant cell that is…
Q: Professional gardeners often soak seeds in hydrogen peroxide before planting them. Why?
A: Unless the right conditions like temperature, water supply etc are available to the seeds, they…
Q: Chlorophyll can only be found in plant cells. True or False
A: Photosynthesis is carried out by the plant, which is a multicellular eukaryotic organism.…
Q: In order for the producers to carry out photosynthesis what is needed
A: On Earth, the living organisms can be classified into two broad categories on the basis of whether…
Q: Why is chlorophyll green? because... it reflects all the colors it absorbs all the colors except…
A: Chlorophyll It is a green colour pigment which help in the photosynthetic activity.
Q: Where do plants acquire most of their carbon from? a. Absorption in the roots b. Organic matter in…
A: The detailed explanation is discussed in step 2.
Q: someone help to write the opinion about photosynthesis
A: Photosynthetic cells capable to trap the light energy through, green photosynthetic pigment…
Q: Plants receive their nutrients mainly from ? atmosphere chlorophyll light soil
A: Nutrition is defined as the process of providing or obtaining food that is necessary for the heath…
Q: A plant with more chlorophyll pigment reflect the color: Red Orange Brown Green
A:
Q: Refer to the following illustration to answer the question. LIGHT O energy O electrons O light…
A: Light harvesting complex These are proteins and photosynthetic pigments that are embedded in the…
Q: Justify the following statement: Sieve plates plays an important role in the translocation pathway…
A: To grow, plants need an energy source. Food is contained in polymers (such as starch) in seeds and…
Q: Most of the abundant gas in the atmosphere is not bioavailable to plants. How does this abundant gas…
A:
Q: GRAPH 1. AMOUNT OF CHLOROPHYLL WITH DIFFERENT AMOUNTS OF LIGHT 600 - Low light --- Moderate light…
A: The given curve has amount of chlorophyll (on y-axis) and time for which light is exposed on to…
Q: Describe how you could determine whether the sugar on your Frosted Flakes is from sugar beets or…
A: Sugar beet and sugar cane : Sugar beets are sliced to produce thin slices from which sugar juice is…
Q: For pineapple plants, the first step of carbon assimilation (incorporating atmospheric CO2 into a…
A: C4 plants are light-dependent plants that undergo the C4 photosynthetic pathway. These plants are…
Q: Based on the absorption spectrum below, which of the following plant pigments does the graph…
A: plant pigment absorbs light in a different wavelength.
Q: The graph shows the effect of increasing light intensity on the rate of photosynthesis.
A: The rate of photosynthesis increases linearly with increasing light intensity ; Gradually the rate…
Q: Which process is most directly driven by light energy?(A) creation of a pH gradient by pumping…
A: Photosynthesis is a process in which the light energy is converted into the chemical energy (in form…
Q: If plants need CO2 to construct glucose (by photosynthesis), why is the rising level of CO2 in the…
A: Photosynthesis is the conversion of light energy into chemical energy by phototrophs, which is then…
Q: Which had a higher respiration rate – germinating or nongerminating corn? Why do you think one type…
A: Cellular respiration is the process of respiration that occurs in the cell cytoplasm or mitochondria…
Q: What is the primary reason why plants use sunlight? a They use it to make oxygen. b They use it to…
A: Introduction The kingdom Plantae contains eukaryotes that are mostly photosynthetic. Algae and…
Q: Pruning results in a greater photosynthetic area and therefore lesser foods are manufactured? True…
A: Introduction Pruning is when you selectively remove branches from a tree, It allows room for new…
Q: is the main photosynthetic pigment that absorbs red and blue portions of the spectrum. This pigment…
A: Given: The main Photosynthetic pigment that absorbs red and blue portions of the spectrum.
Q: Not yet answered Points out of 1.00 P Flag question is the main photosynthetic pigment that absorbs…
A: Plant pigment knwon to reffer by the term that the molecules state to absorb exclusively light the…
Q: Opening and closing of pores is a function performed by: I. Stomata II.…
A: Stomata are cellular structures present in the epidermis of the leaves. They are involved in the…
Q: What part of the chloroplast contains chlorophyll
A: The chloroplast is the site of photosynthesis. It is divided into stroma and thylakoid. The light…
Q: The increase in air CO2 concentration leads to global warming and extreme weather. What are the…
A: C4 species, the photosynthesis is nearly saturated under recent ambient [CO2] von Caemmerer, It has…
Q: plant are use _______ as an energy source to drive photosynthesis a. sunlight c.…
A: Photosynthesis is a process that occurs in plants and other chlorophyll-containing organisms. As it…
Q: What kind of results can we get from measuring O2 and CO2 production of spinach leaves in the light…
A: Photosynthesis has both light and dark reactions Light reactions are called so because they happen…
Q: In which light the plant growth rate is highest?
A: In plants light is a driving force for the process of photosynthesis. Through photosynthesis plants…
Q: how would misting a plant affect the transpiration rate?
A: If a plant is misted, then rate of transpiration will be slowed down because the moist environment…
Q: In datepalm, chlorophyll is located in the-
A: The region present between the upper and lower epidermis of leaves is called mesophyll cells.…
Q: What does AlDS stand for
A: HIV (human immunodeficiency virus) is a virus that can attack the immune system of a person and if…
Q: What is transpiration? Why is the use of transpiration? Write any three environmental factors that…
A: Aerial plant parts lose water through transpiration, which is the process of water vaporising out of…
Q: Why do plants need to exchange gases with the environment?
A: Introduction In this question we will discuss about why plants need to exchange gases with…
Q: Photoinhibition is when the rate of photosynthesis is decreased or even stopped due to excessive…
A: The photosynthesis process begins when solar energy or light absorbed via the pigment of the plant…


Trending now
This is a popular solution!

Step by step
Solved in 2 steps


- What is the concentration of chlorophyll B if an absorbance of 1 is measured at 431nm in a cuvette with a pathlength of 1cm. (Chlorophyll B Extinction coefficient: 57.43 mM-1 cm-1)Briefly explain why the 14C/12C ratio will decrease after the death of plants. A three- to four-sentence explanation is needed.Based on the absorption spectrum below, which of the following plant pigments does the graph represent? A.)Phycocetin (red algae)B.)ChlorophyllC.)Beta caroteneD.)Phycocyanin (cyanobacteria)
- We perform our measurements for KHP at 281 nm. Would we get the same results for pathlength at 250 nm? What about using chlorophyll at 667 nm? Why might a too high concentration of KHP give erroneous data for measuring pathlength?The following essential oils are not phototoxic: Choose one answer. a. fig leaf absolute b. steam distilled citrus c. cold pressed citrus d. angelica rootWhat are nature way chlorophyll concentrate benefits? And what does chlorophyll concentrate does for your body?
- Syngas biomass and Co2 hydrogenation which one is the most sustainable process in methanol production?The absorption spectrum of chlorophyll a differs from the actionspectrum of photosynthesis. Explain this observation.Why is hydrogen sulfide production monitored during fermentation? Why is this end product undesirable in wine production?
- Explain the mechanism behind salt as a food preservative.All of the following essential oils are suitable for chronic pain except: Choose one answer. a. grapefruit b. verbena c. ylang ylang d. lemongrassWhat aeration condition (presence or absence of O2) favors cell growth? What is the metabolic explanation for this influence of oxygen on biomass formation?