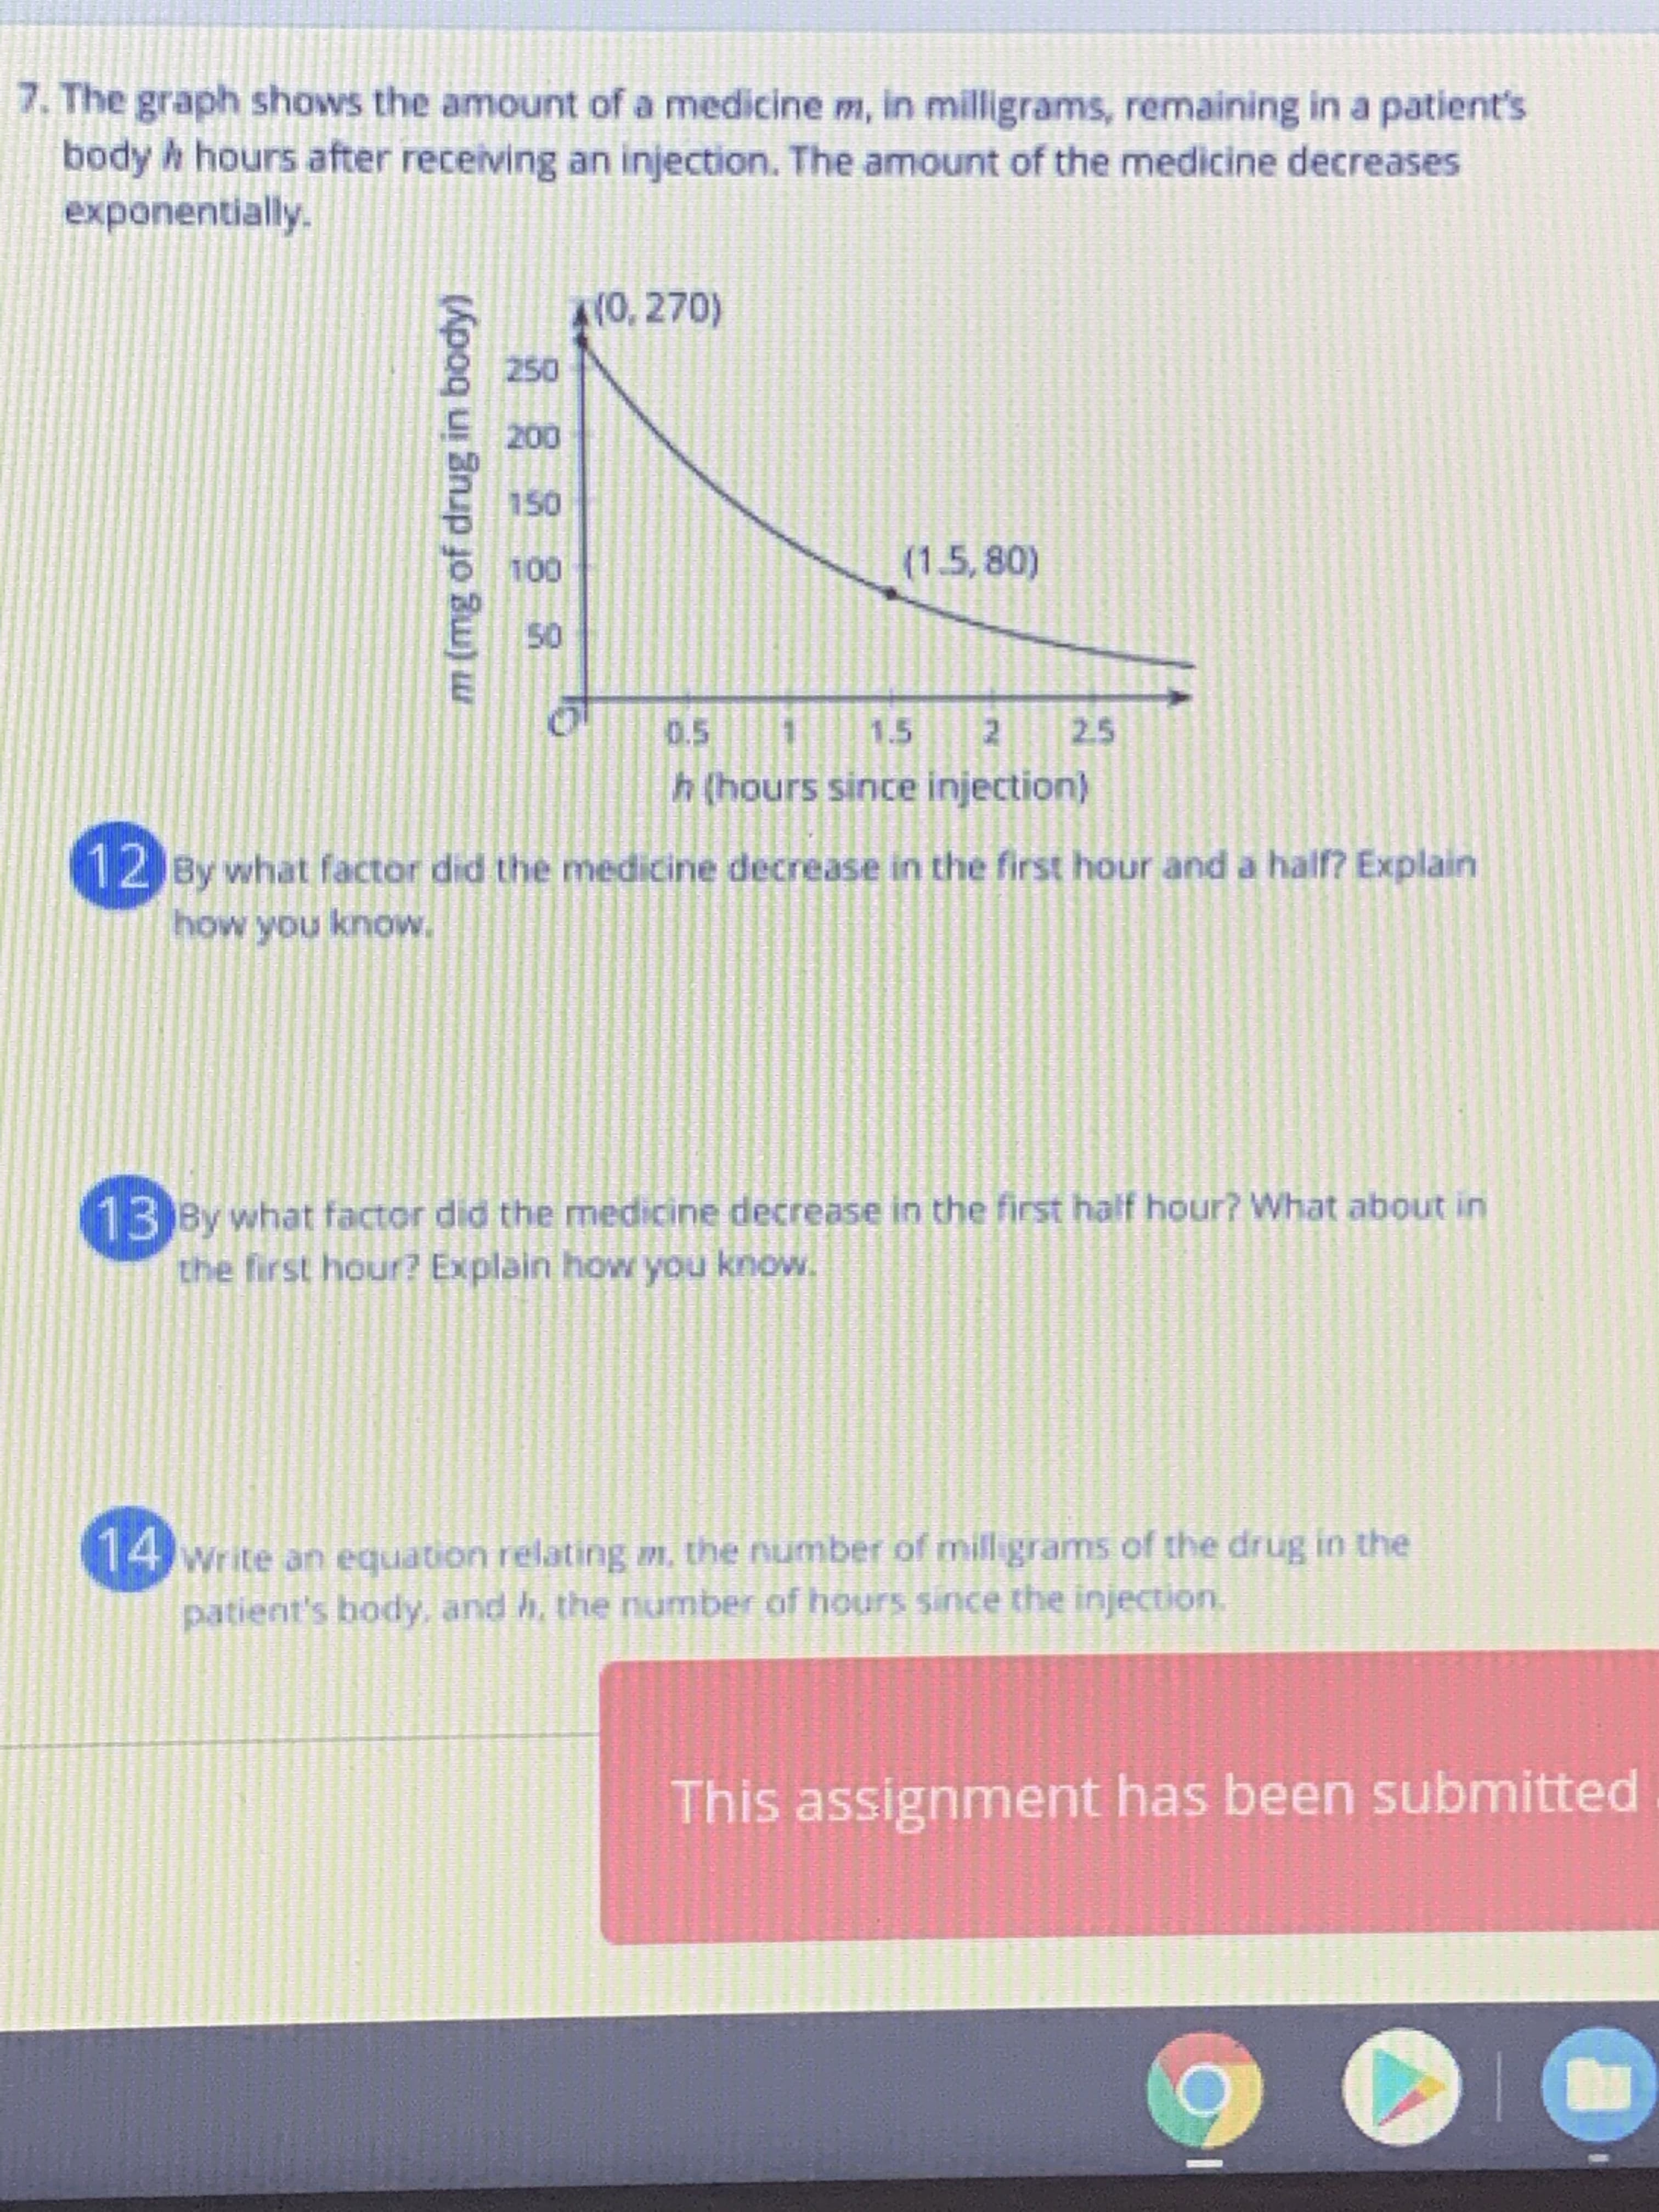
The graph shows the amount of a medicine m, in milligrams, remaining in a patient's body h hours after receiving an injection. The amount of the medicine decreases exponentially. (0, 270) 250 200 150 100 (1.5,80) 50 0.5 1.5 2. 2.5 h (hours since injection) m (mg of drug in body)
The graph shows the amount of a medicine m, in milligrams, remaining in a patient's body h hours after receiving an injection. The amount of the medicine decreases exponentially. (0, 270) 250 200 150 100 (1.5,80) 50 0.5 1.5 2. 2.5 h (hours since injection) m (mg of drug in body)

Glencoe Algebra 1, Student Edition, 9780079039897, 0079039898, 2018
18th Edition
ISBN:9780079039897
Author:Carter
Publisher:Carter
Chapter10: Statistics
Section10.2: Representing Data
Problem 14PPS

Related questions

Concept explainers
Equations and Inequations
Equations and inequalities describe the relationship between two mathematical expressions.
Linear Functions
A linear function can just be a constant, or it can be the constant multiplied with the variable like x or y. If the variables are of the form, x2, x1/2 or y2 it is not linear. The exponent over the variables should always be 1.
Question
Transcribed Image Text:The graph shows the amount of a medicine m, in milligrams, remaining in a patient's
body h hours after receiving an injection. The amount of the medicine decreases
exponentially.
(0, 270)
250
200
150
100
(1.5,80)
50
0.5
1.5
2.
2.5
h (hours since injection)
m (mg of drug in body)
Expert Solution
This question has been solved!
Explore an expertly crafted, step-by-step solution for a thorough understanding of key concepts.

This is a popular solution!

Trending now
This is a popular solution!

Step by step
Solved in 7 steps with 1 images

Knowledge Booster


Learn more about
Need a deep-dive on the concept behind this application? Look no further. Learn more about this topic, algebra and related others by exploring similar questions and additional content below.Recommended textbooks for you
Glencoe Algebra 1, Student Edition, 9780079039897…
Algebra
ISBN:
9780079039897
Author:
Carter
Publisher:
McGraw Hill

Algebra & Trigonometry with Analytic Geometry
Algebra
ISBN:
9781133382119
Author:
Swokowski
Publisher:
Cengage

Functions and Change: A Modeling Approach to Coll…
Algebra
ISBN:
9781337111348
Author:
Bruce Crauder, Benny Evans, Alan Noell
Publisher:
Cengage Learning
Glencoe Algebra 1, Student Edition, 9780079039897…
Algebra
ISBN:
9780079039897
Author:
Carter
Publisher:
McGraw Hill
Algebra & Trigonometry with Analytic Geometry
Algebra
ISBN:
9781133382119
Author:
Swokowski
Publisher:
Cengage
Functions and Change: A Modeling Approach to Coll…
Algebra
ISBN:
9781337111348
Author:
Bruce Crauder, Benny Evans, Alan Noell
Publisher:
Cengage Learning